
Fig. 3
|
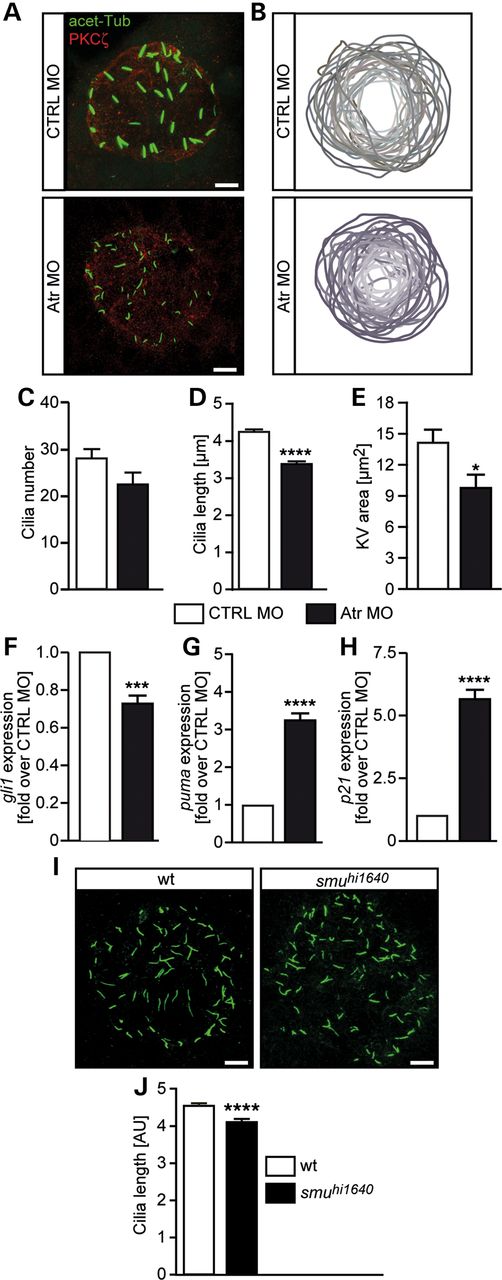
Fig. 3
Atr depletion confers shorter cilia in zebrafish. (A) Representative images of cilia in the KV of zebrafish embryos. Cilia were stained with an antibody against acetylated tubulin. Outlines of the KV were visualized by counterstaining with an antibody against atypical PKC (PKCζ). Scale bars: 5 µm. (B) Overlay of KV outlines of CTRL MO- or Atr MO-injected embryos [eight somite stage (ss)]. Depletion of Atr results in slightly smaller KVs. (C) Cilia number was not significantly altered upon Atr depletion. Three independent experiments with 31 embryos per condition. P = 0.0770, Student′s t-test. (D) KV cilia were short in embryos depleted for Atr. n = 7. About 10-831 cilia from 29 to 31 embryos. P < 0.0001, Student′s t-test. (E) KV area measurements of CTRL- and Atr MO-injected embryos at eight ss. Three independent experiments with 31 embryos in total. P = 0.0166, Student′s t-test. (F) gli1 expression at 24 hpf after injection of either CTRL MO or Atr MO. Four independent experiments. P = 0.0008, Student′s t-test. (G) Relative expression of puma in injected embryos (24 hpf). n = 4, P < 0.0001, Student′s t-test. (H) p21 expression in 24 hpf embryos summarizing four independent experiments. P < 0.0001, Student′s t-test. (I) Representative images of KV cilia in a zebrafish mutant for Smo (smuhi1640). Scale bars: 5 µm. (J) Average cilia length in smuhi1640 mutants and wild-type littermates. n = 1094-1826 cilia from 20 to 27 singly genotyped embryos. P < 0.0001, Student′s t-test.