
IMAGE
Fig. 2
- ID
- ZDB-IMAGE-160414-5
- Genes
- Publication
- Langdon et al., 2016 - Split top: A maternal cathepsin B that regulates dorsoventral patterning and morphogenesis
- All Figures
- Figures for Langdon et al., 2016
Image
|
Figure Caption
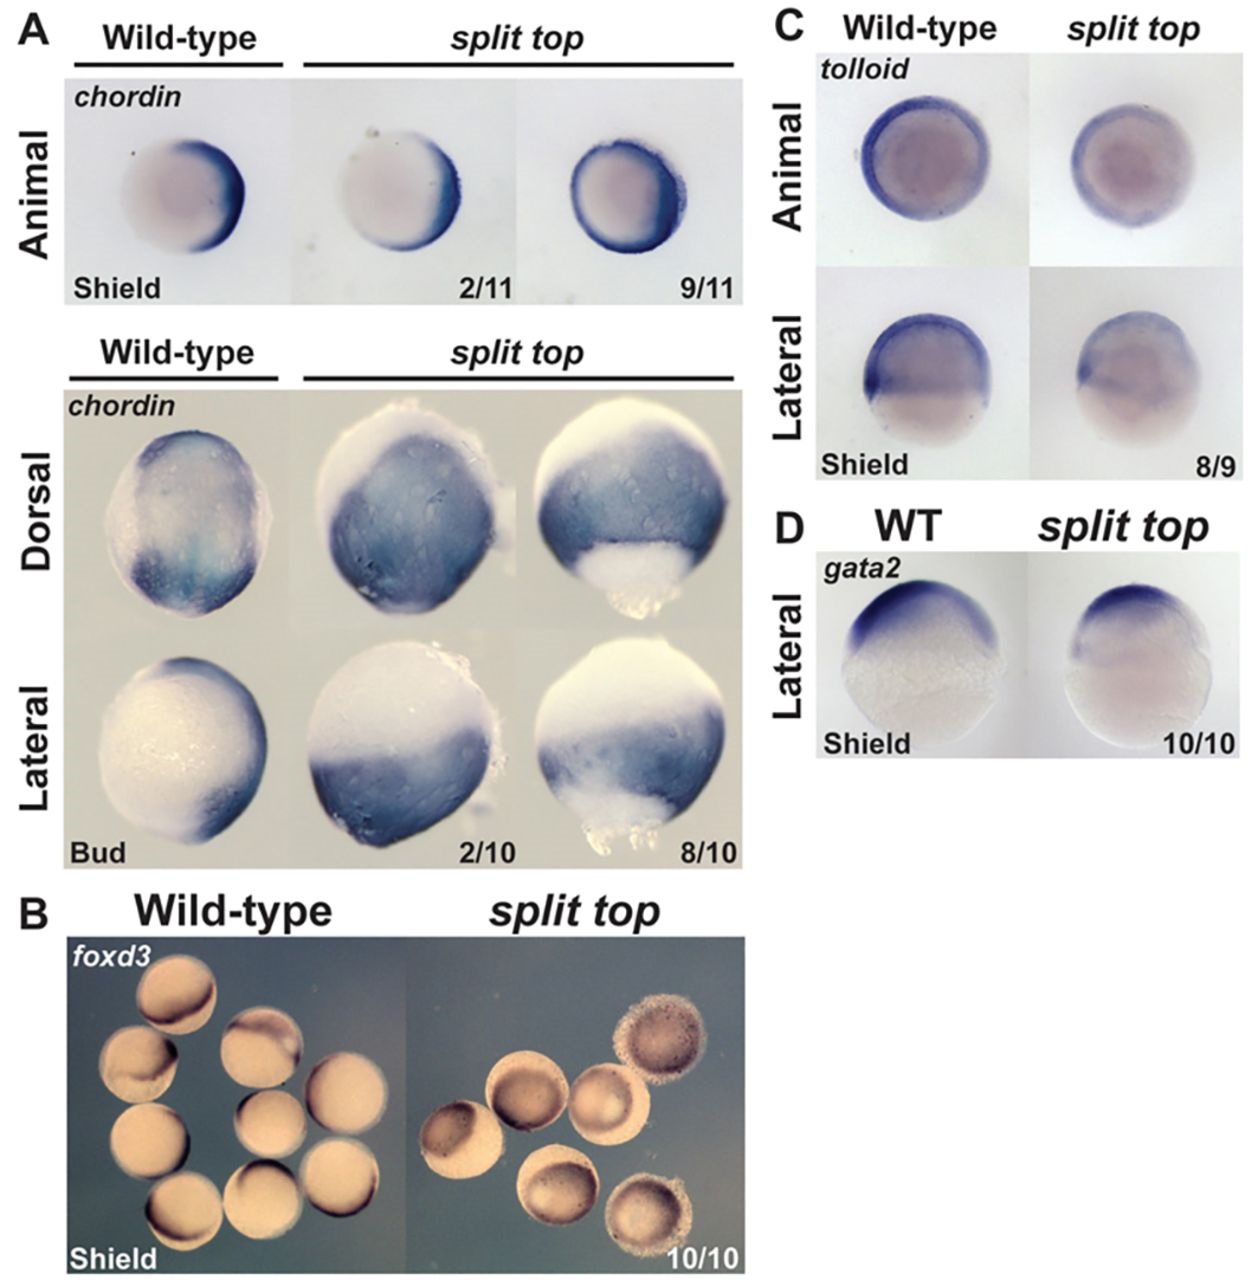
Fig. 2
Dorsoventral marker analysis. (A) chordin, (B) foxd3, (C) tolloid and (D) gata2 expression. Animal and lateral views, dorsal to right. Dorsal views, anterior to top.
Figure Data
Acknowledgments
This image is the copyrighted work of the attributed author or publisher, and
ZFIN has permission only to display this image to its users.
Additional permissions should be obtained from the applicable author or publisher of the image.
Full text @ Development