
|
Fig. 4
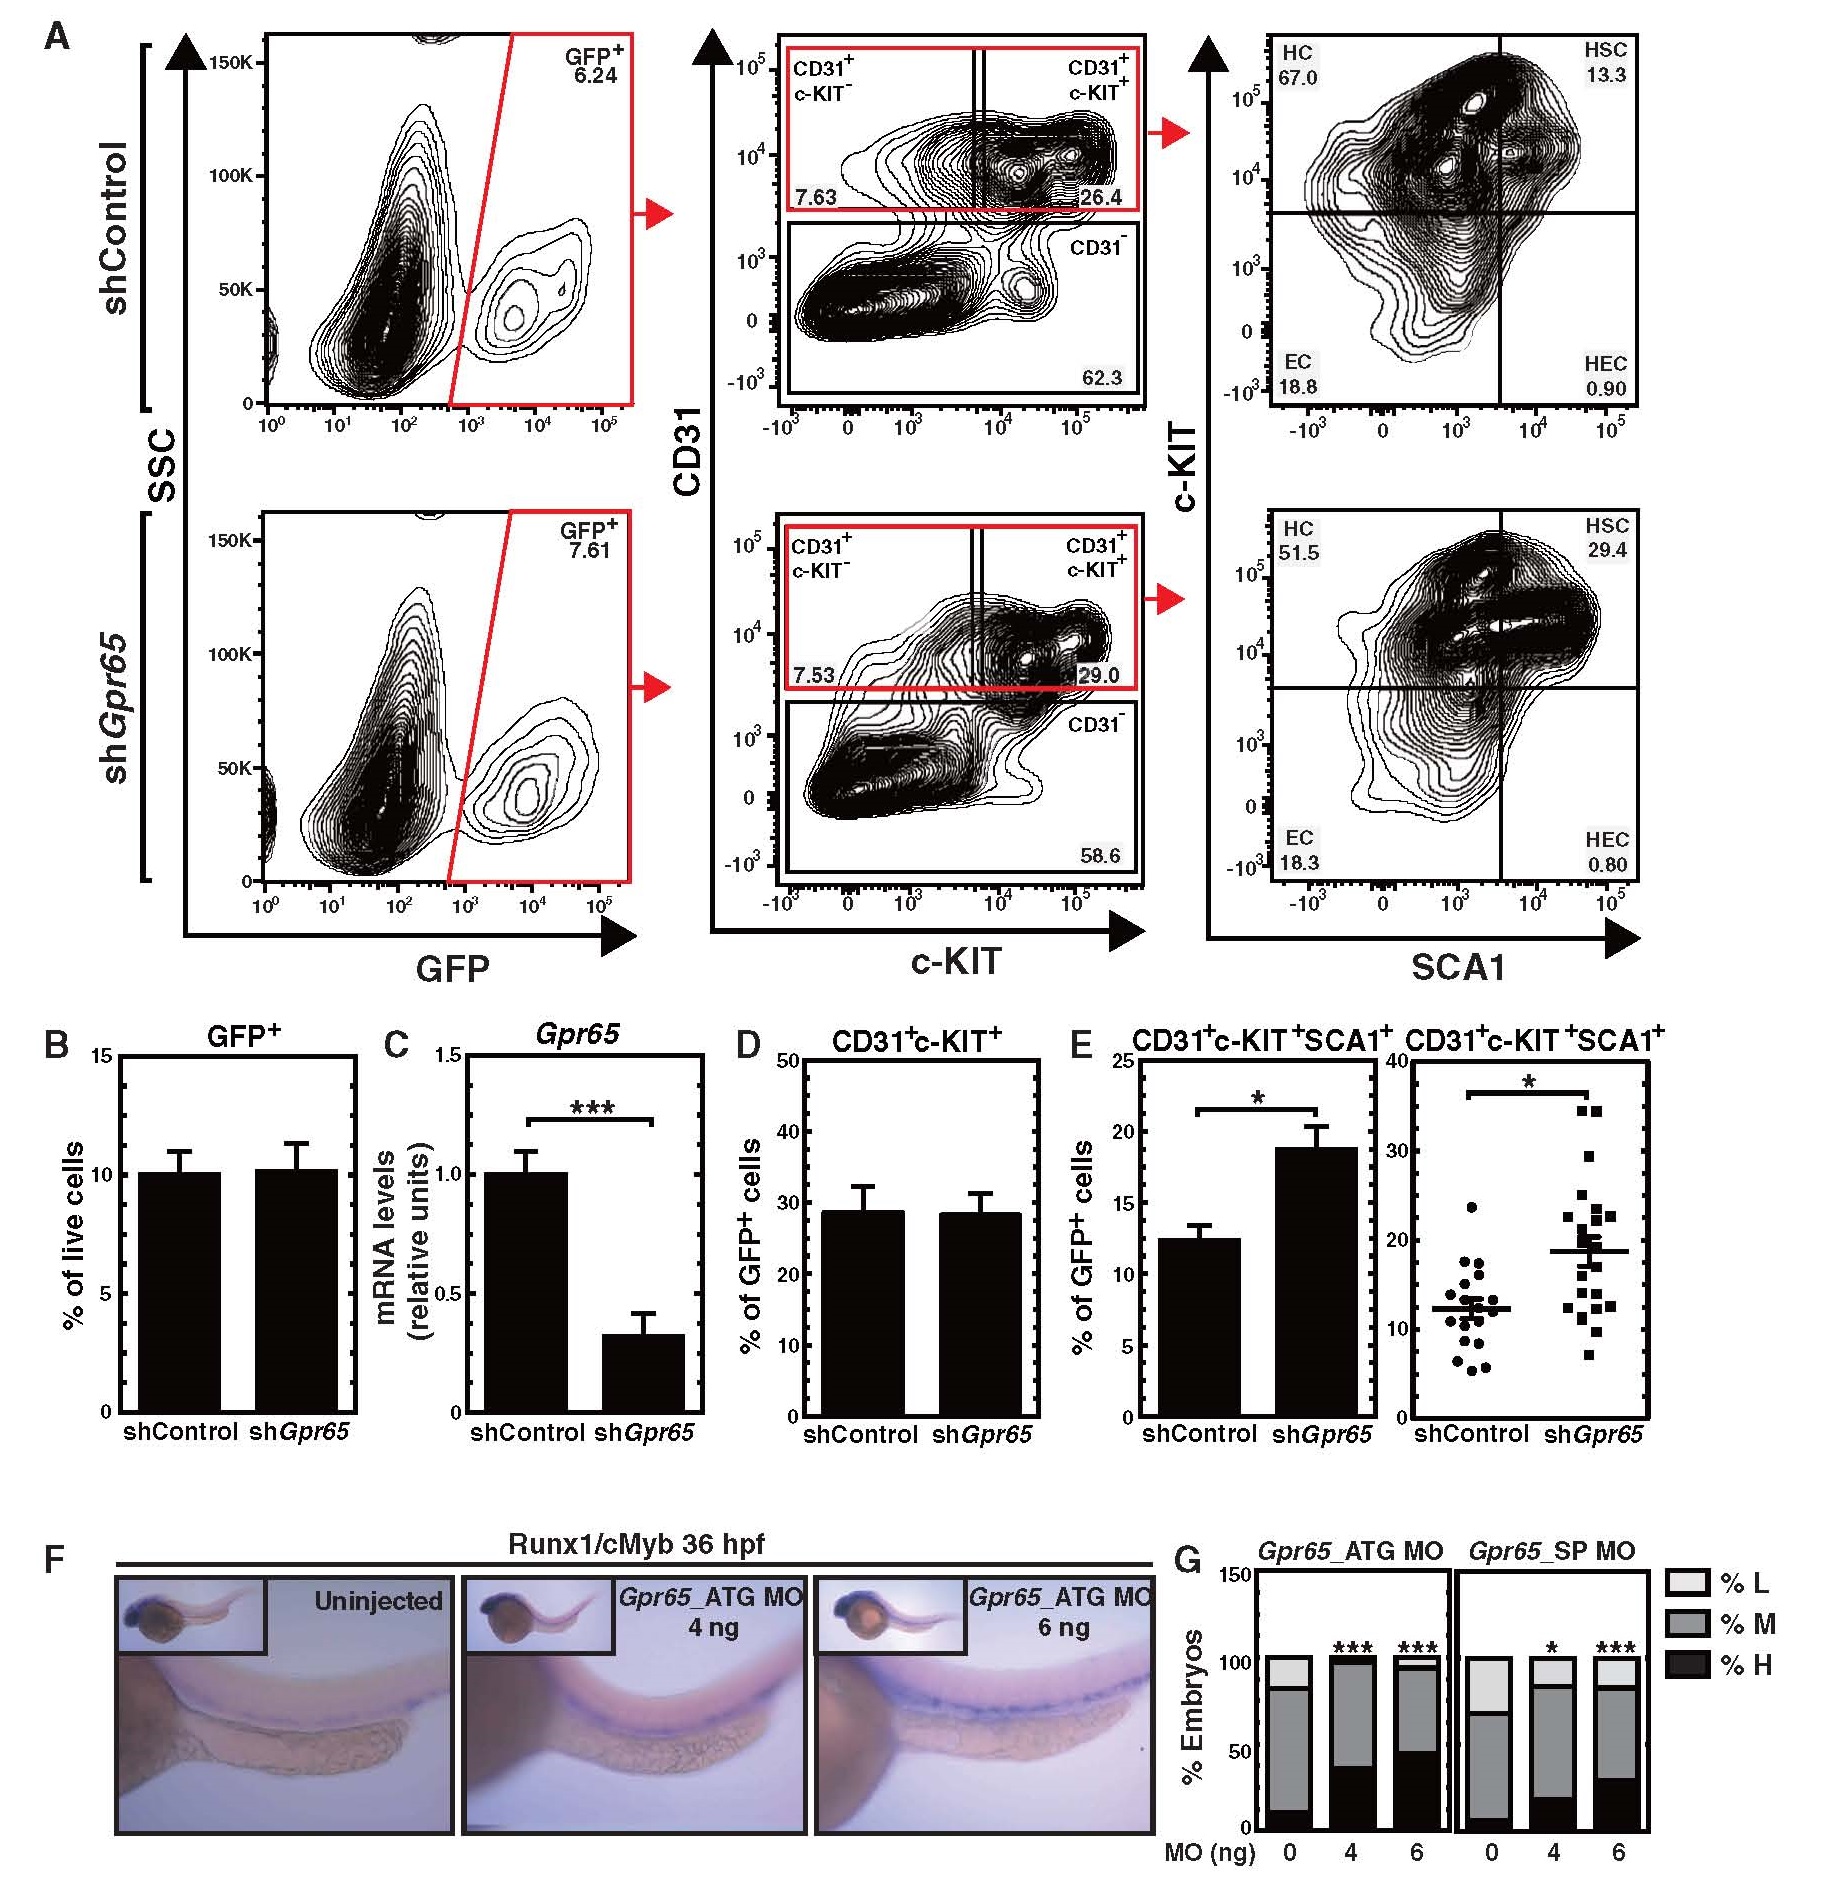
GPR65 Suppresses Hematopoiesis in the Mouse and Zebrafish AGM.
(A) Representative flow cytometric plots of CD31+c-KIT+ and CD31+c-KIT+SCA1+ cell populations in control or Gpr65 shRNA-treated AGMs after 96 hr of culture.
(B) Quantitation of GFP+ cells with total live cells (9 litters: shLuc [n = 22 embryos]; shGpr65 [n = 26 embryos]).
(C) RT-PCR analysis of Gpr65 mRNA levels in FACS-sorted GFP+ cells (6 litters: shLuc [n = 15 embryos]; shGpr65 [n = 15 embryos]).
(D and E) Analysis of flow cytometry data expressed as percentage of CD31+c-KIT+ (D) and CD31+c-KIT+Scal1+ (E) cells in GFP+ cells (D: 9 litters: shLuc [n = 22 embryos]; shGpr65 [n = 26 embryos]; E: 7 litters: shLuc [n = 18]; shGpr65 [n = 22]).
(F) Representative images of ISH with the HSPC markers Runx1/cMyb at 36 hr post-fertilization.
(G) Quantitation of ISH data expressed as percentage of embryos with high, medium, and low Runx1/cMyb staining in total embryos (ATG MO 0 ng [124 embryos]; ATG MO 4 ng [75 embryos]; ATG MO 6 ng [66 embryos]; SP MO 0 ng [97 embryos]; SP MO 4 ng [49 embryos]; SP MO 6 ng [58 embryos]). Gpr65_ATG MO: morpholino targeting the translation start site of Gpr65; Gpr65_SP MO: morpholino blocking the splicing of Gpr65.
Error bars represent SEM. p < 0.05; ***p < 0.001 (two-tailed unpaired Student′s t test).