
|
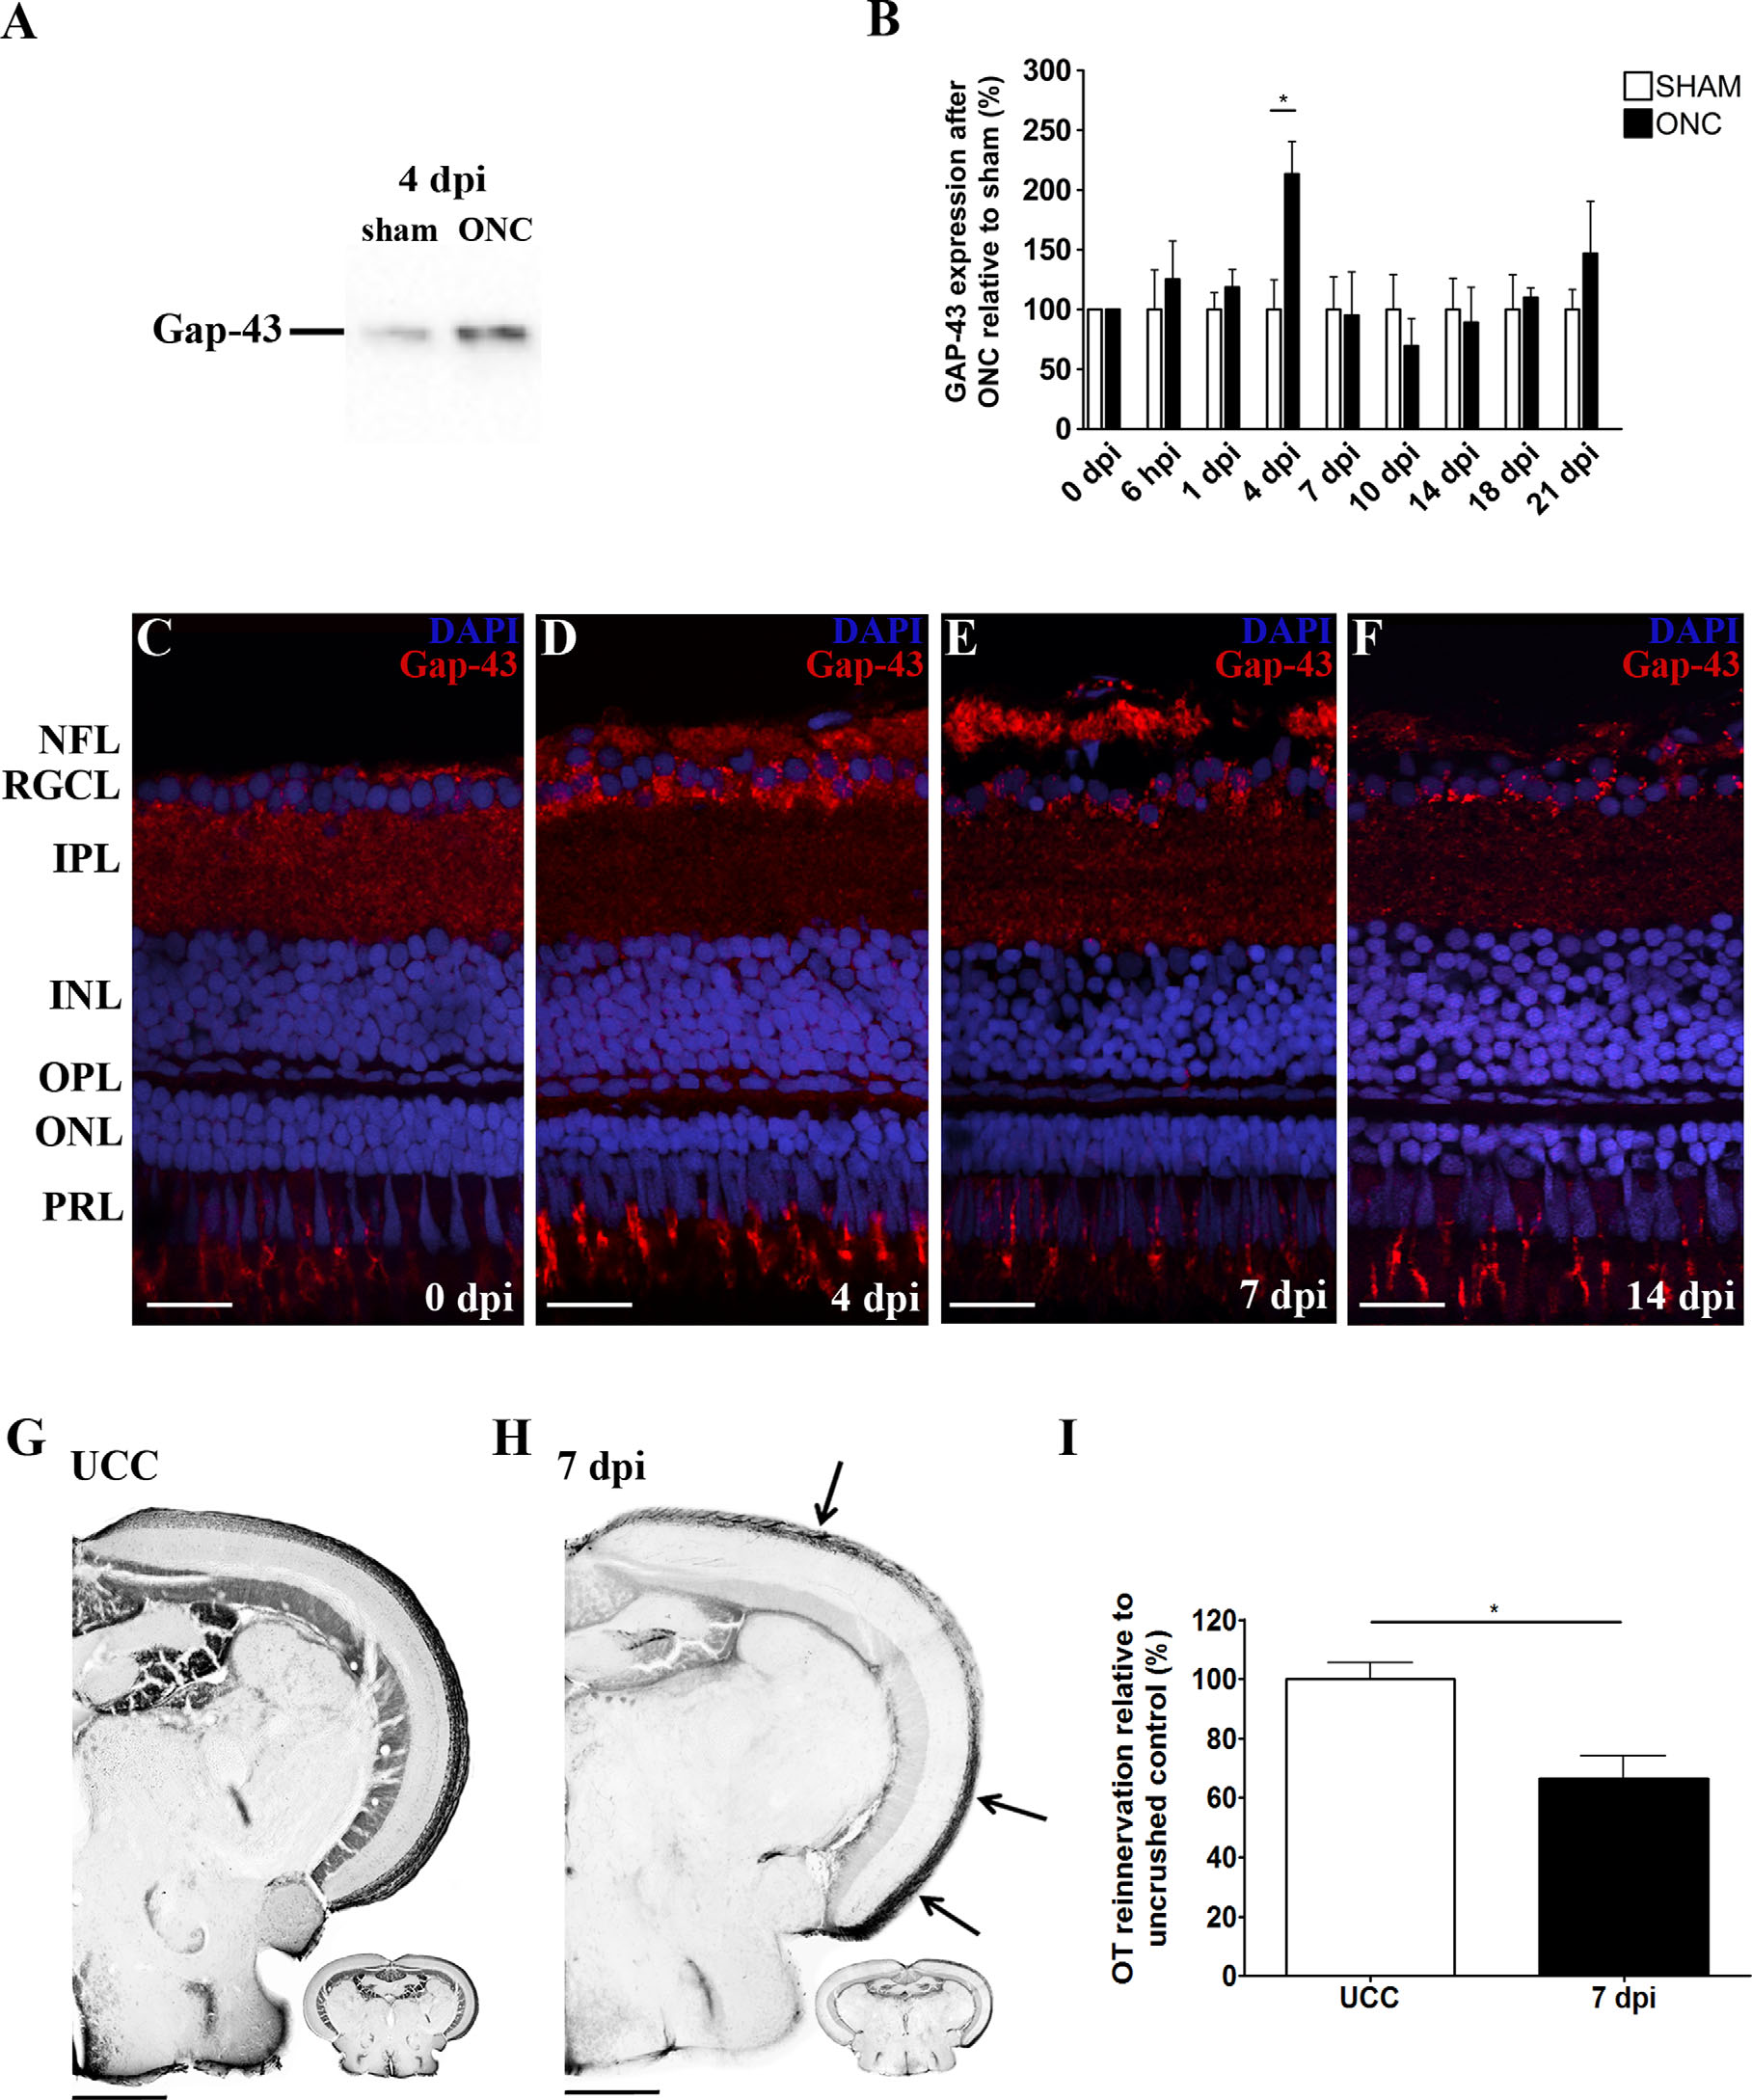
Fig. 1
Mapping of RGC axonal regrowth after ONC in adult zebrafish. A,B: Western blotting (WB) for Gap-43 (20-25 kDa) on retinal extracts harvested at different timepoints after optic nerve crush (ONC) reveals a peak in Gap-43 expression at 4 days postinjury (dpi). For the quantitative analysis, values from ONC samples were plotted relative to sham-operated values, which were put at 100%. Data were collected from at least three retinal samples per timepoint and are shown as mean ± SEM (*P < 0.05). C-F: Immunostainings for Gap-43 on retinal sections at various stages postinjury show Gap-43 upregulation in retinal ganglion cell (RGC) somata at 4 dpi and increasing Gap-43 signal in RGC axons from 4-7 dpi. Gap-43 expression reapproaches control levels at 14 dpi. DAPI (blue) was used as nuclear counterstain. G,H: Microscopic images of biocytin-labeled brain sections of uncrushed control fish (UCC) and 7 dpi fish visualizing innervation of the contralateral optic tectum (OT) by RGC axons. Regenerating RGC axons entering the OT at 1 week postinjury are indicated by arrows. I: Quantification of the area covered by RGC axons in the OT at 7 dpi, relative to UCC, confirms that axonal regeneration is fully ongoing. Data represent mean ± SEM (n = 5 animals per group, *P < 0.05). ONC, optic nerve crush; dpi, days postinjury; UCC, uncrushed control; NFL, nerve fiber layer; RGCL, retinal ganglion cell layer; IPL, inner plexiform layer; INL, inner nuclear layer; OPL, outer plexiform layer; ONL, outer nuclear layer; PRL, photoreceptor layer. Scale bars = 20 µm in C-F; 200 µm in G,H.