
|
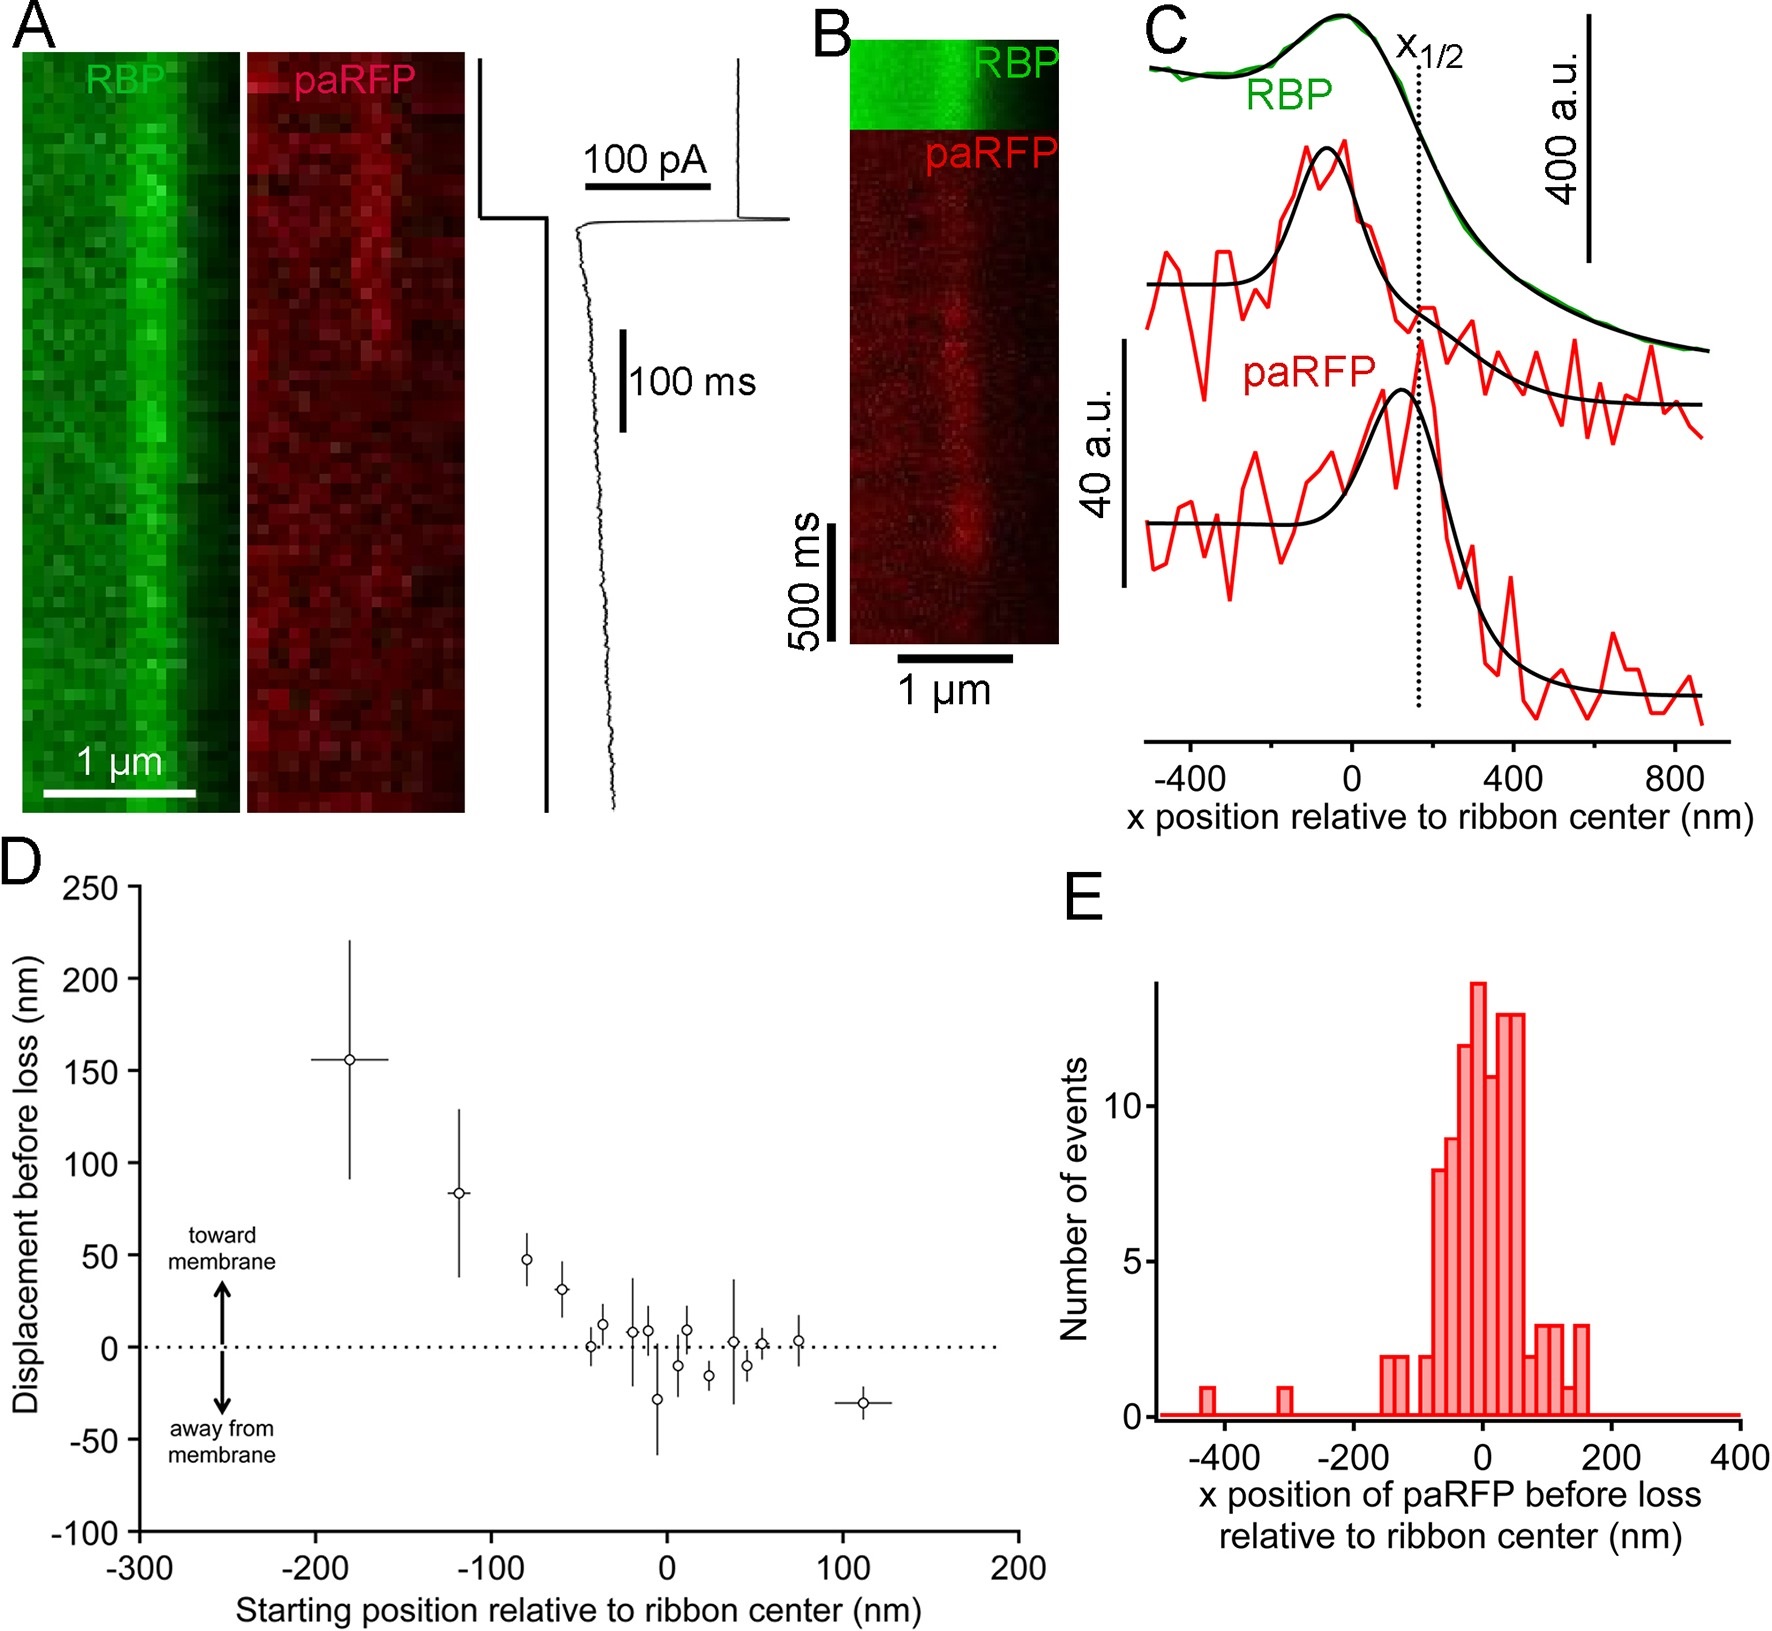
Fig. 4
Movement and loss of vesicles during sustained depolarization.(A) Example x-t images in which a previously stable paRFP-labeled vesicle disappeared from view during sustained depolarization. The timing of depolarization and the evoked Ca2+ current are shown to the right. Analysis of x-t line scan images is described in Figure 3. (B) Example showing a paRFP-labeled vesicle that appeared distal to the center of the ribbon during sustained depolarization, moved toward the membrane, and disappeared along a Gaussian time course (Figure 4-figure supplement 1). (C) Fluorescence intensity profiles along the x-axis for the example in panel B, showing ribbon position (green) and paRFP positions at appearance and disappearance (red). Black lines are fits described in Figure 3. The dotted line shows the estimated position of the plasma membrane estimated from x1/2 obtained from the fit to RBP fluorescence. (D) Displacement amplitude for 88 paRFP-labeled vesicles along the x-axis prior to disappearance, as a function of initial starting position relative to the center of the ribbon. Positive and negative displacements are movements toward and away from the membrane, respectively. Open circles show the average of groups of five points binned by starting position. Error bars: ± 1 sem. Positive starting positions are nearer the membrane, and negative positions are farther away. (E) Histogram of final positions of paRFP-labeled vesicles along the x-axis just before disappearance.