
|
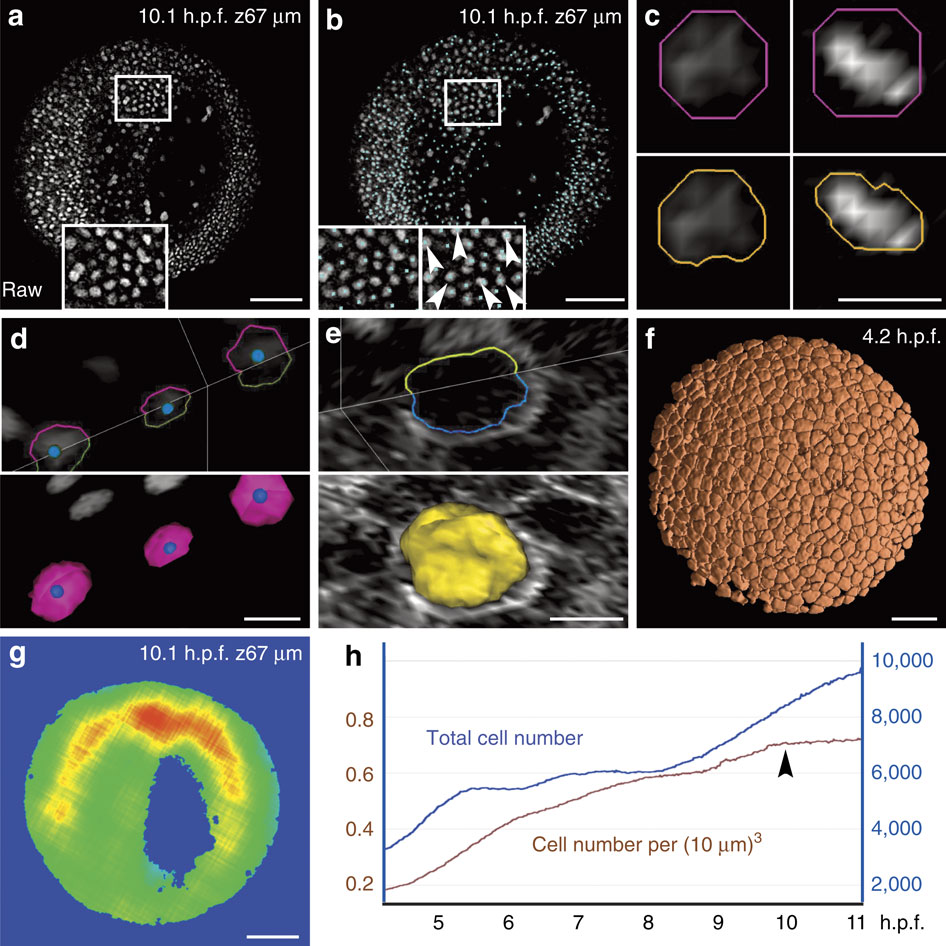
Fig. 3
Chain of PDE-based algorithms for the 3D segmentation of embryonic cells.
Results from the zebrafish data set Dr1. Scale bars in µm (100 in a,b,f,g, 10 in c,d,e). (a) Raw data image; single z section at 67 µm depth (orientation as in Fig. 2d), magnification in inset. (b) Nucleus centre detection by the FBLS method, after filtering by GMCF; approximate centres (cyan cubes) superimposed on raw data (grey levels, same orthoslice as a). Magnification in insets: left inset at depth 67 µm; right inset located one section deeper, showing that several centres not displayed at 67 µm were in fact correctly detected and visible below the chosen plane (white arrowheads); remaining centres can be found on other planes using the Mov-IT interactive visualization tool. (c) Nucleus segmentation by SubSurf method; left panels: an interphase nucleus; right panels: a metaphase nucleus; top panels: initial segmentation (pink contour) superimposed on raw data (grey levels); bottom panels: final segmentation (orange contours) superimposed on the same raw data. (d) Nucleus segmentation by SubSurf method; top panel: three nuclear contours superimposed on two raw-data orthoslices; bottom panel: 3D rendering of the segmented nuclei on a single orthoslice. (e) Membrane segmentation by SubSurf method; top panel: one cell membrane contour superimposed on two-raw data orthoslices; bottom panel: 3D rendering of the segmented membrane shape on a single orthoslice. (f) 3D rendering of segmented cell shapes. (g) Embryo shape segmentation; local cell density increasing from blue to red (same orthoslice as a). (h) Total cell number (blue curve) and cell density (brown curve) as a function of time; arrow indicates the end of gastrulation correlating with a plateau in cell density.