
Image
|
Figure Caption
Fig. S2
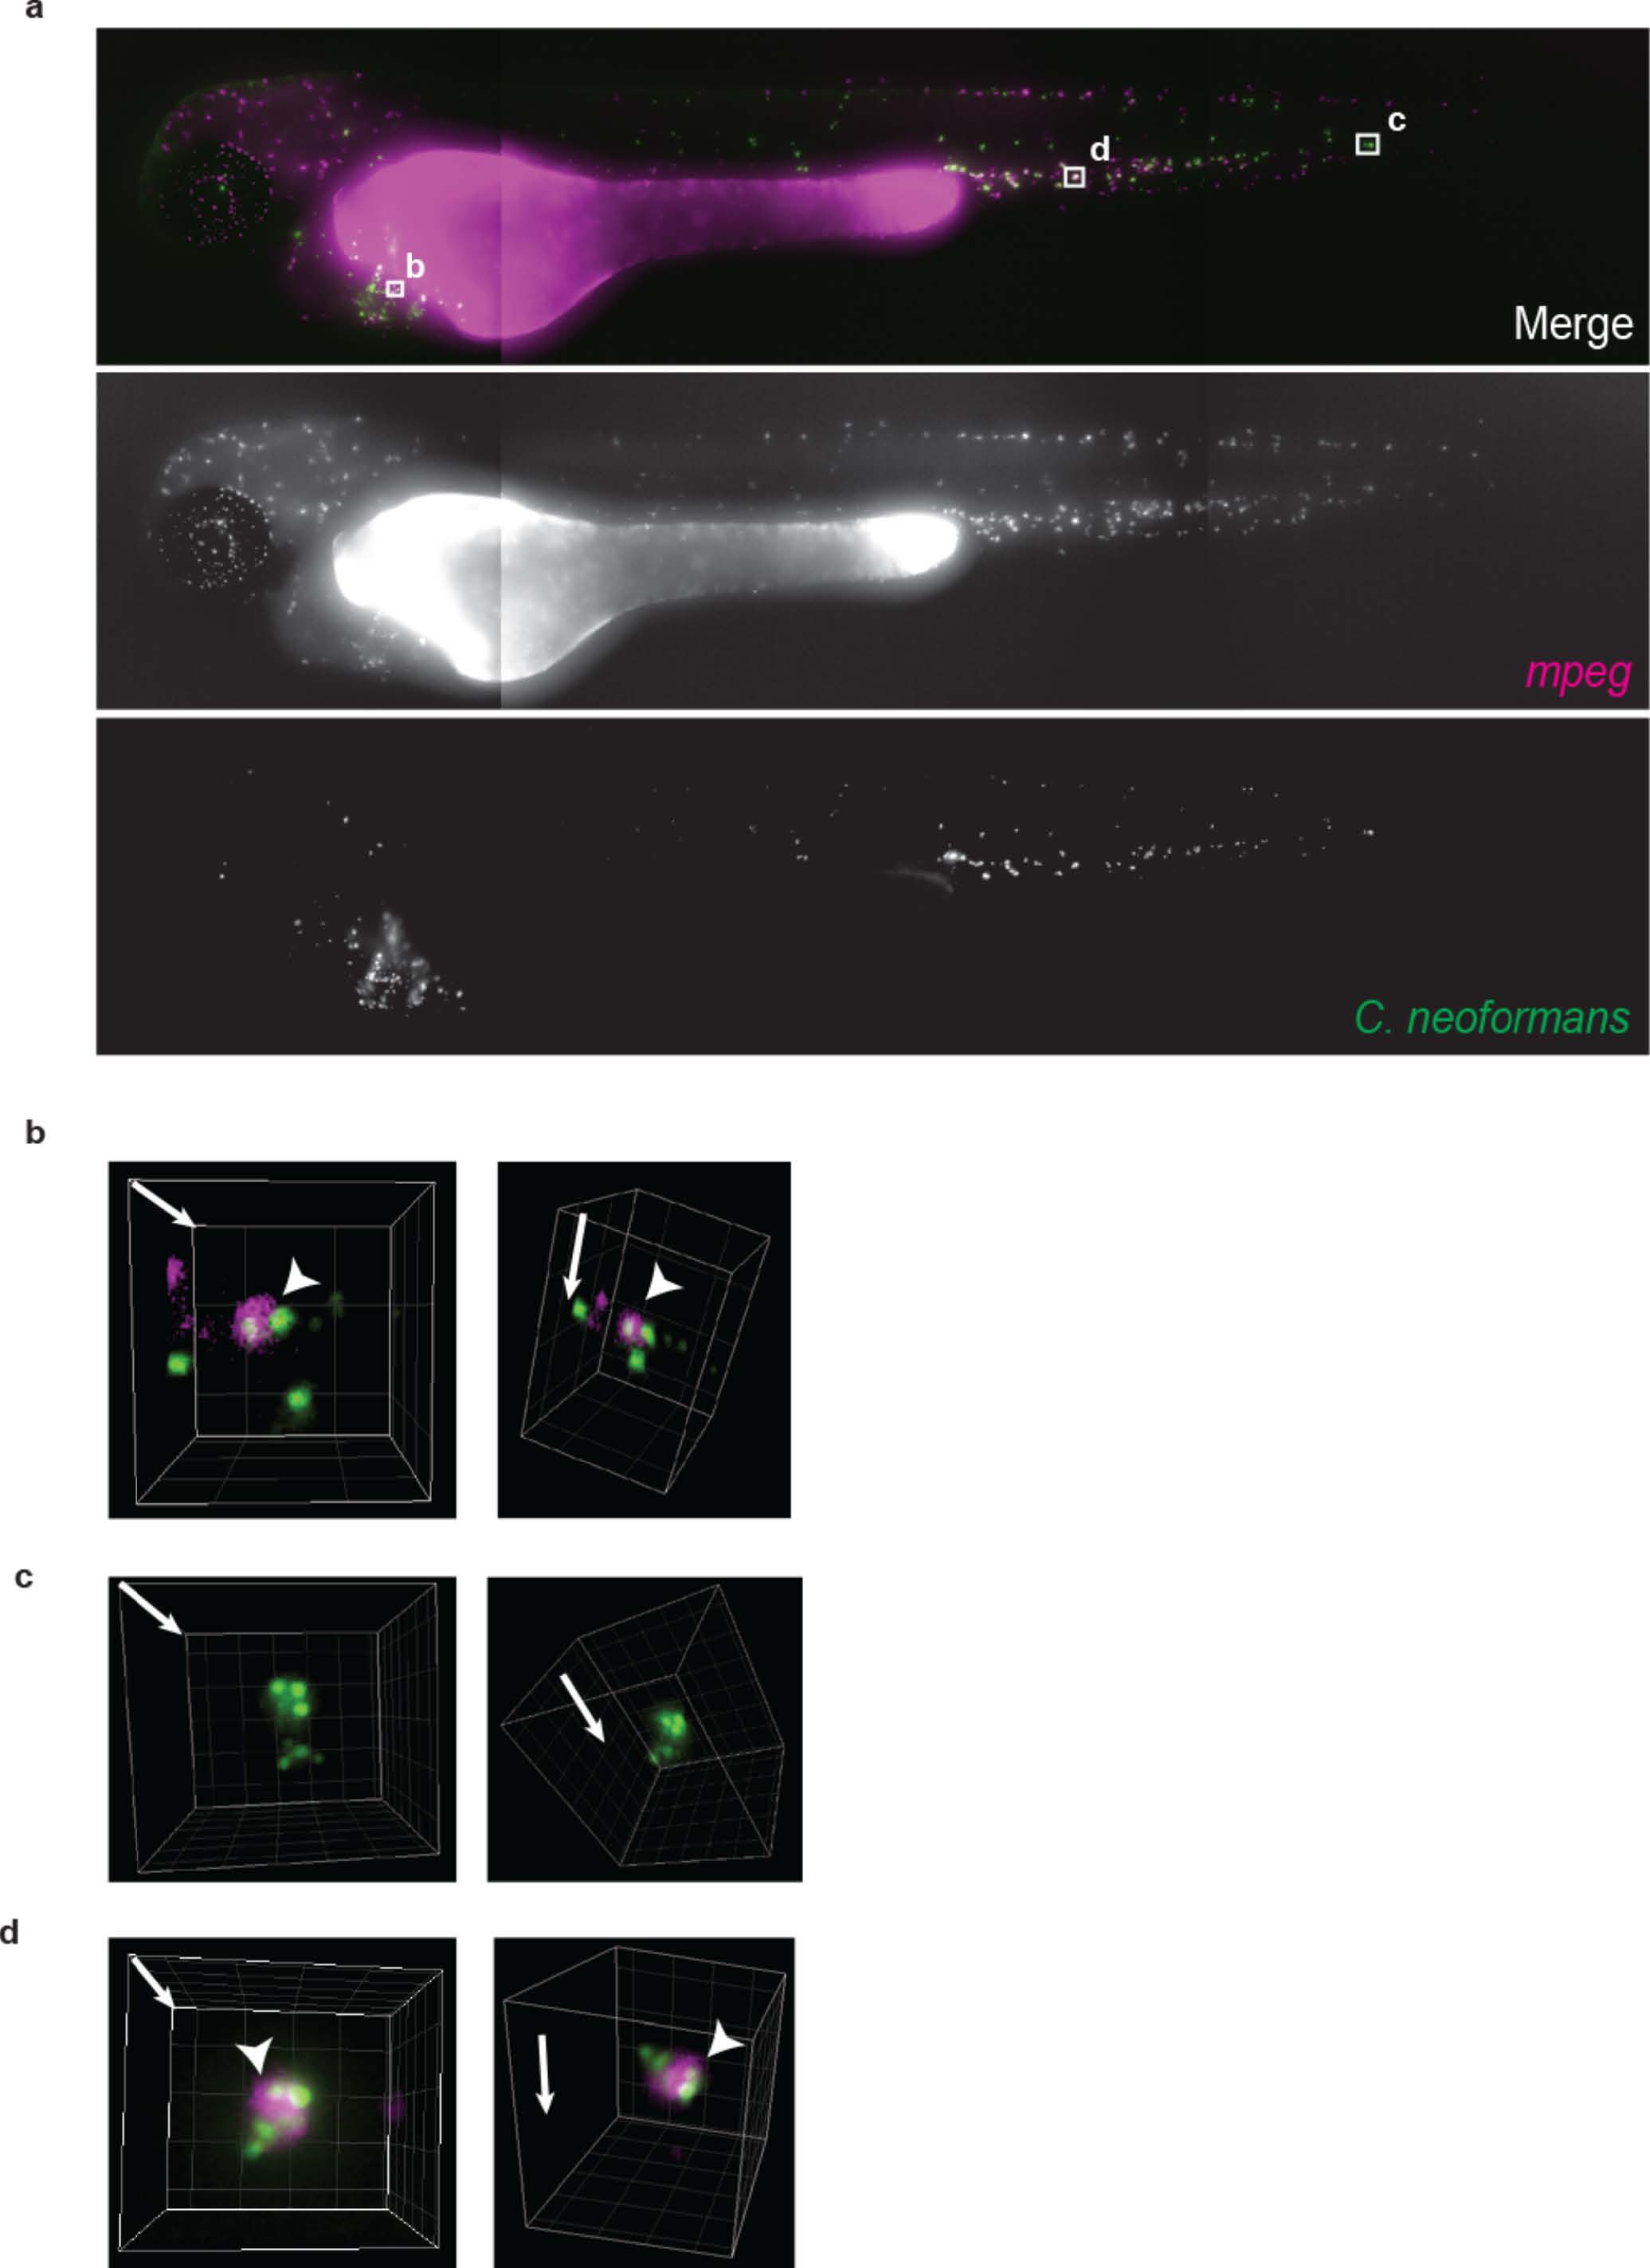
Quantification of macrophage behavior in response to Cryptococcus during infection using mpeg macrophage marker. (a) Maximum intensity z-projection of example image data from high content imaging of Tg(mpeg1:mCherryCAAX)sh378 zebrafish, with mCherry labeled macrophages (magenta), infected with 208 cells of C. neoformans strain H99GFP (green), at 2 hours post infection. (b,c,d). Areas boxed in (a) enlarged and reconstructed in three-dimensions. 42 Arrowheads indicate intracellular cryptococci. Image pairs represent different views of same volume with arrows indicating z-axis direction. Image grid is 20µm.
Acknowledgments
This image is the copyrighted work of the attributed author or publisher, and
ZFIN has permission only to display this image to its users.
Additional permissions should be obtained from the applicable author or publisher of the image.
Full text @ Sci. Rep.