
|
Fig. 4
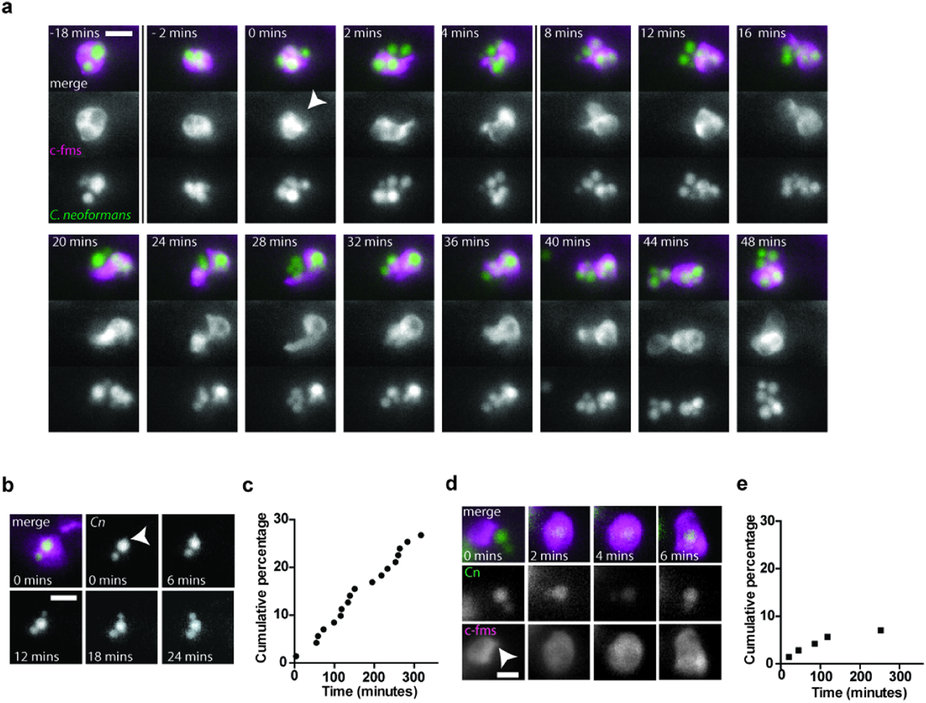
Increase in intracellular numbers of cryptococci is driven by proliferation not phagocytosis. (a,b,d) Fluorescent time lapse imaging of parasitism of macrophages. Tg(fms:Gal4.VP16)i186; Tg(UAS:nfsB.mCherry)i149 zebrafish, with mCherry labeled macrophages (c-fms; magenta), infected with C. neoformans strain H99GFP (green). Zebrafish were imaged for 12 hours from 2 hpi. Images were captured every 2 minutes. (a) Vomocytosis. Selected frames are presented before and after vomocytic event (0 mins). Arrowhead indicates the formation of concave macrophage membrane with vomocytosis. Vomocytosed cryptococci leave the imaged volume post 48 minutes (see Supplementary Movie S1). Scale bar 10 µm. (b) Intracellular proliferation. Selected frames are presented from when bud is first visible (arrowhead). (c) Quantification of intracellular proliferation from time lapse imaging. Each occurrence of intracellular budding yeast was counted over 12 hours. Data presented is a cumulative percentage of yeast that budded over the time of observation. (d) Phagocytosis. Selected frames are presented from formation of phagocytic cup (arrowhead). (e) Quantification of phagocytosis from time lapse imaging. Each occurrence of phagocytosis was counted over 12 hours. Data presented is a cumulative percentage of yeast that were phagocytosed over the time of observation. Quantitation of intracellular proliferation and phagocytosis are from 22 infected macrophages and are representative of n = 5.