
|
Fig. 1
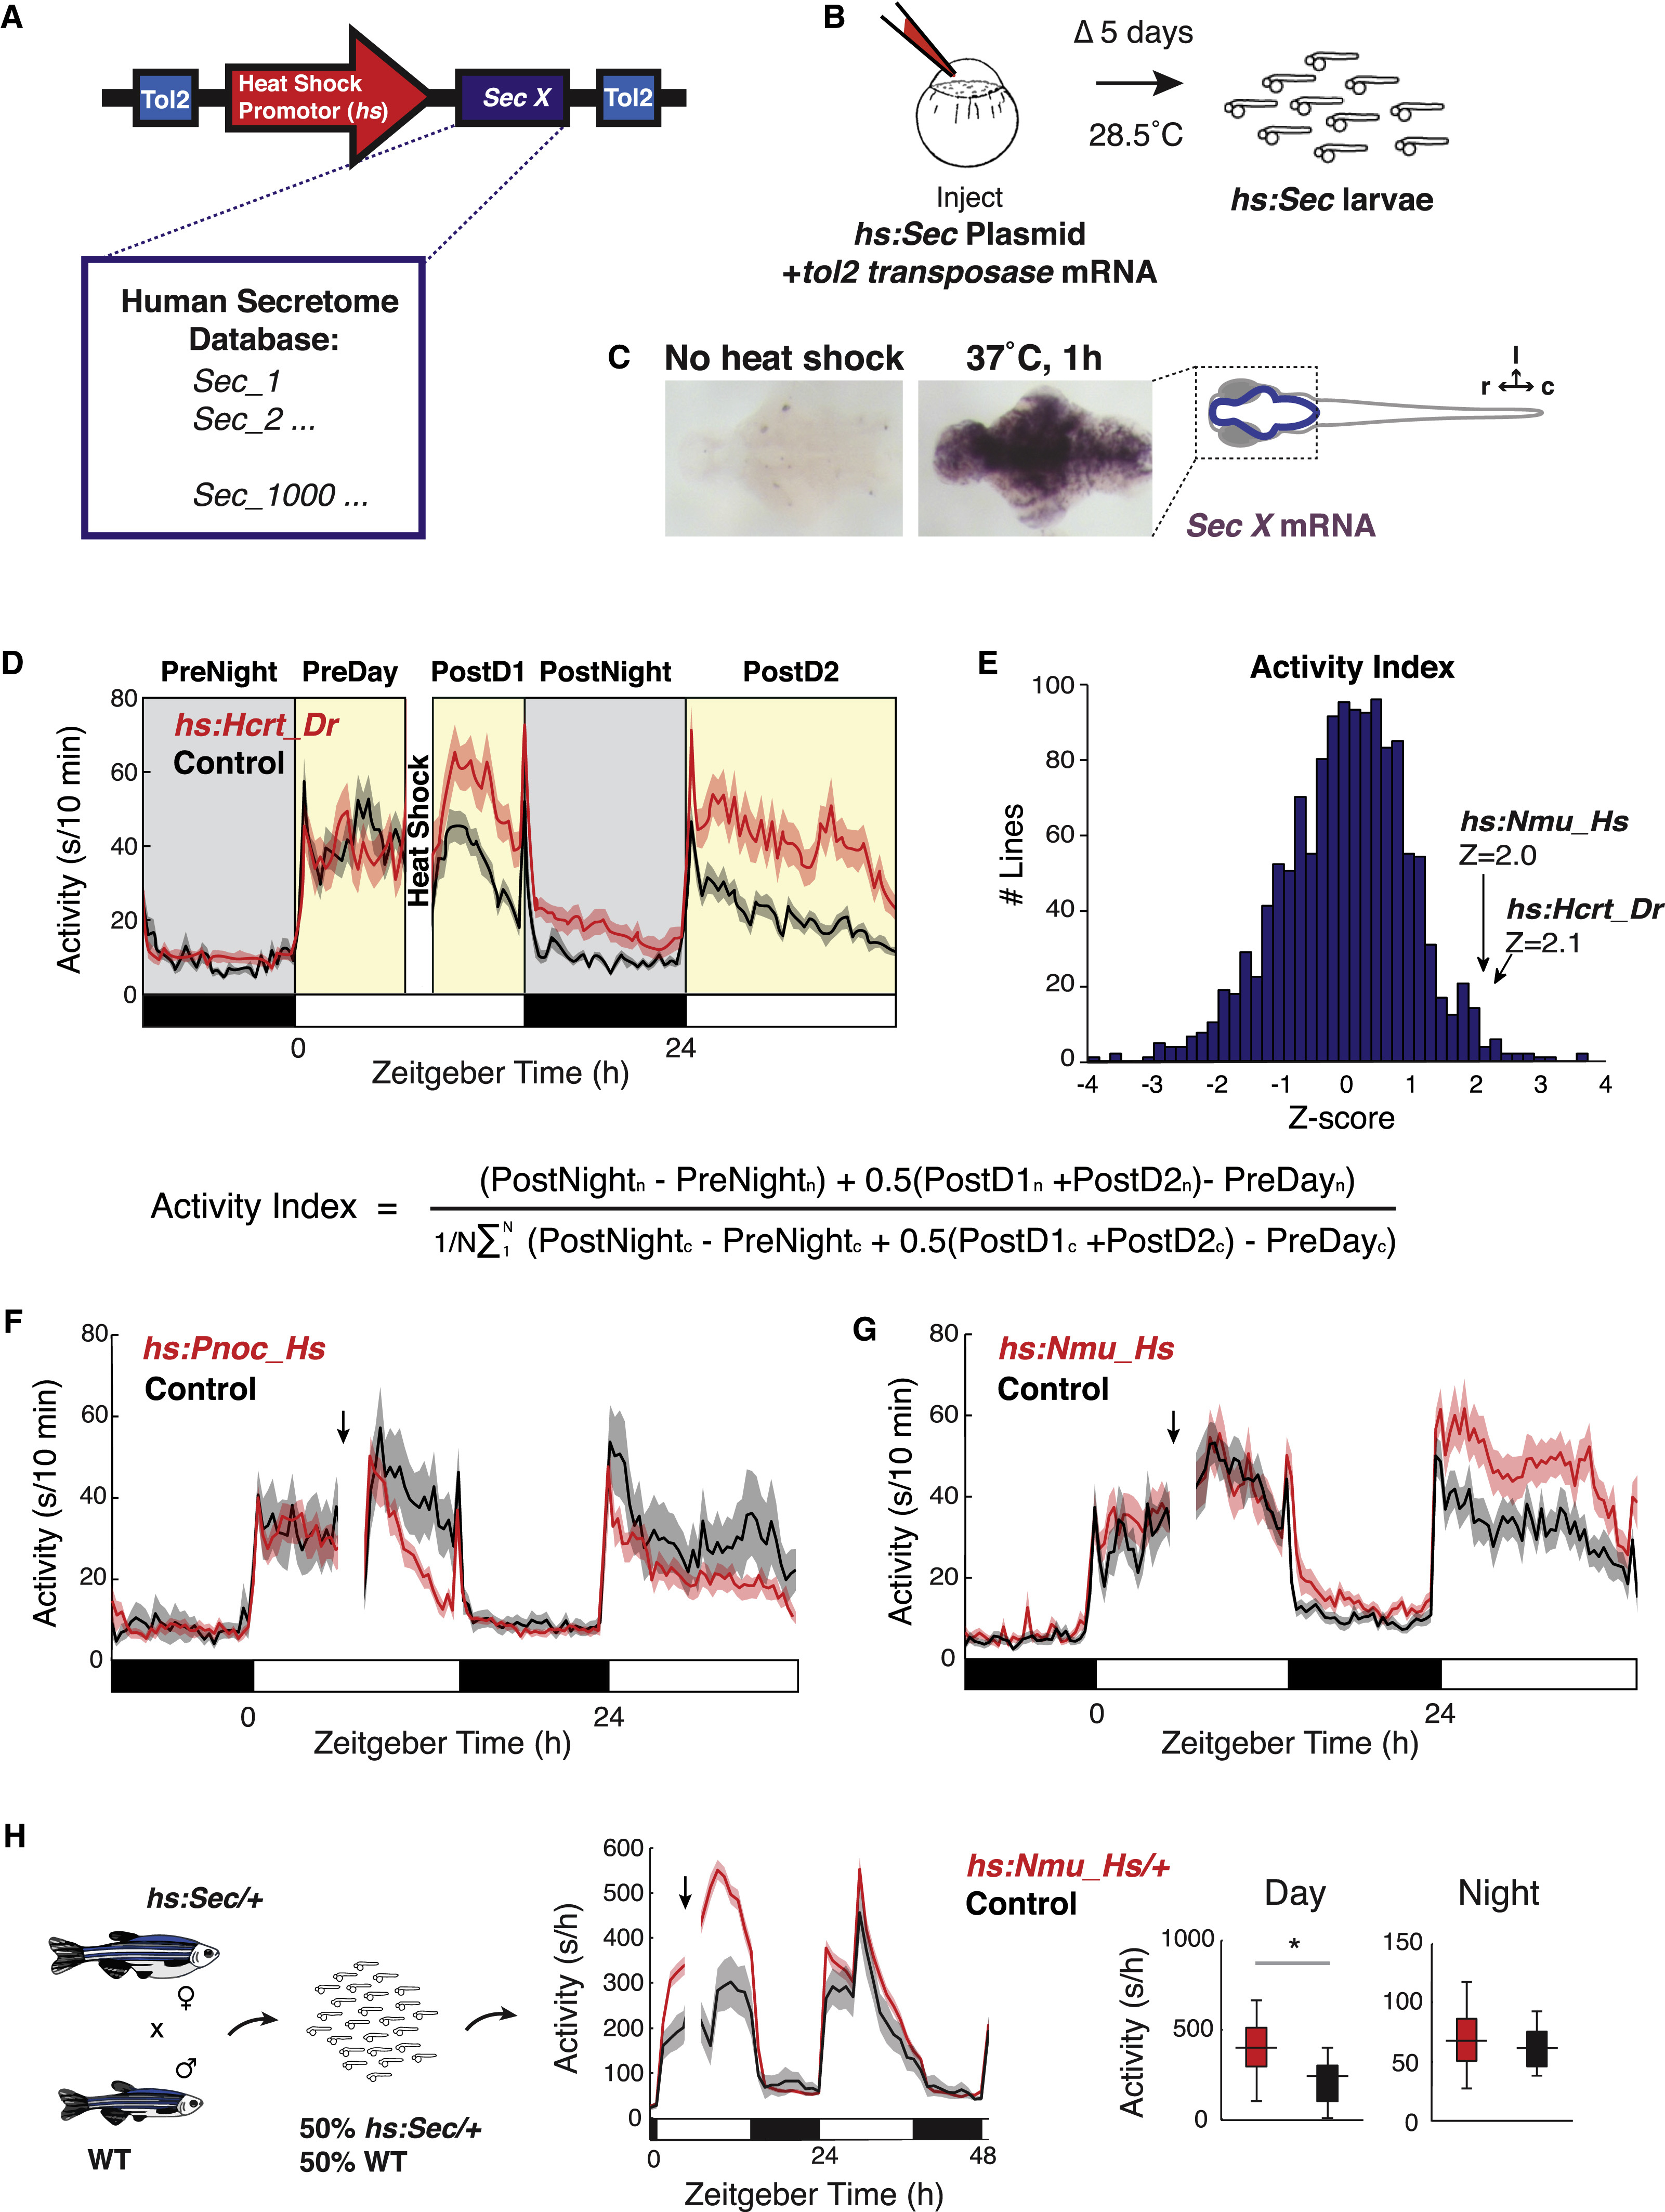
A Behavioral Genetic Overexpression Screen
(A) The Heat Shock Secretome (hs:Sec) overexpression transgenesis cassette.
(B) In the primary screen, single cell zebrafish embryos were co-injected with the hs:Sec plasmid and tol2 transposase mRNA. Embryos were raised to 5 days post-fertilization (dpf) at 28.5°C, a non-permissive temperature for the heat shock promoter.
(C) A 1 hr, 37°C heat shock (but not the 28.5°C control) treatment induces expression of a Secretome gene in hs:Sec/+ larvae, as visualized by in situ hybridization (purple stain) in dissected brains.
(D) Average activity traces for hs:Hcrt_Dr-injected (n = 32) and control injected (n = 16) larvae.
(E) Histogram of all activity indices from the screen, normalized as standard deviations from the mean (Z score).
(F) Average activity traces of controls and hs:Pnoc_Hs, a previously identified regulator of sleep/wake behavior in zebrafish.
(G) Average activity traces of controls and hs:Nmu_Hs, a newly identified regulator of sleep/wake behavior in zebrafish.
(H) Candidate genes were retested as stable transgenic lines. hs:Nmu_Hs/+ larvae generated from a stable transgenic line exhibited increased activity compared to their WT siblings. Line plot values are represented as mean ± SEM. White and black boxes on the x axis of the line plots denote daytime light periods and nighttime dark periods, respectively. Arrows indicate time of heat shock (F-H). *p < 0.05, Mann-Whitney U test.