
|
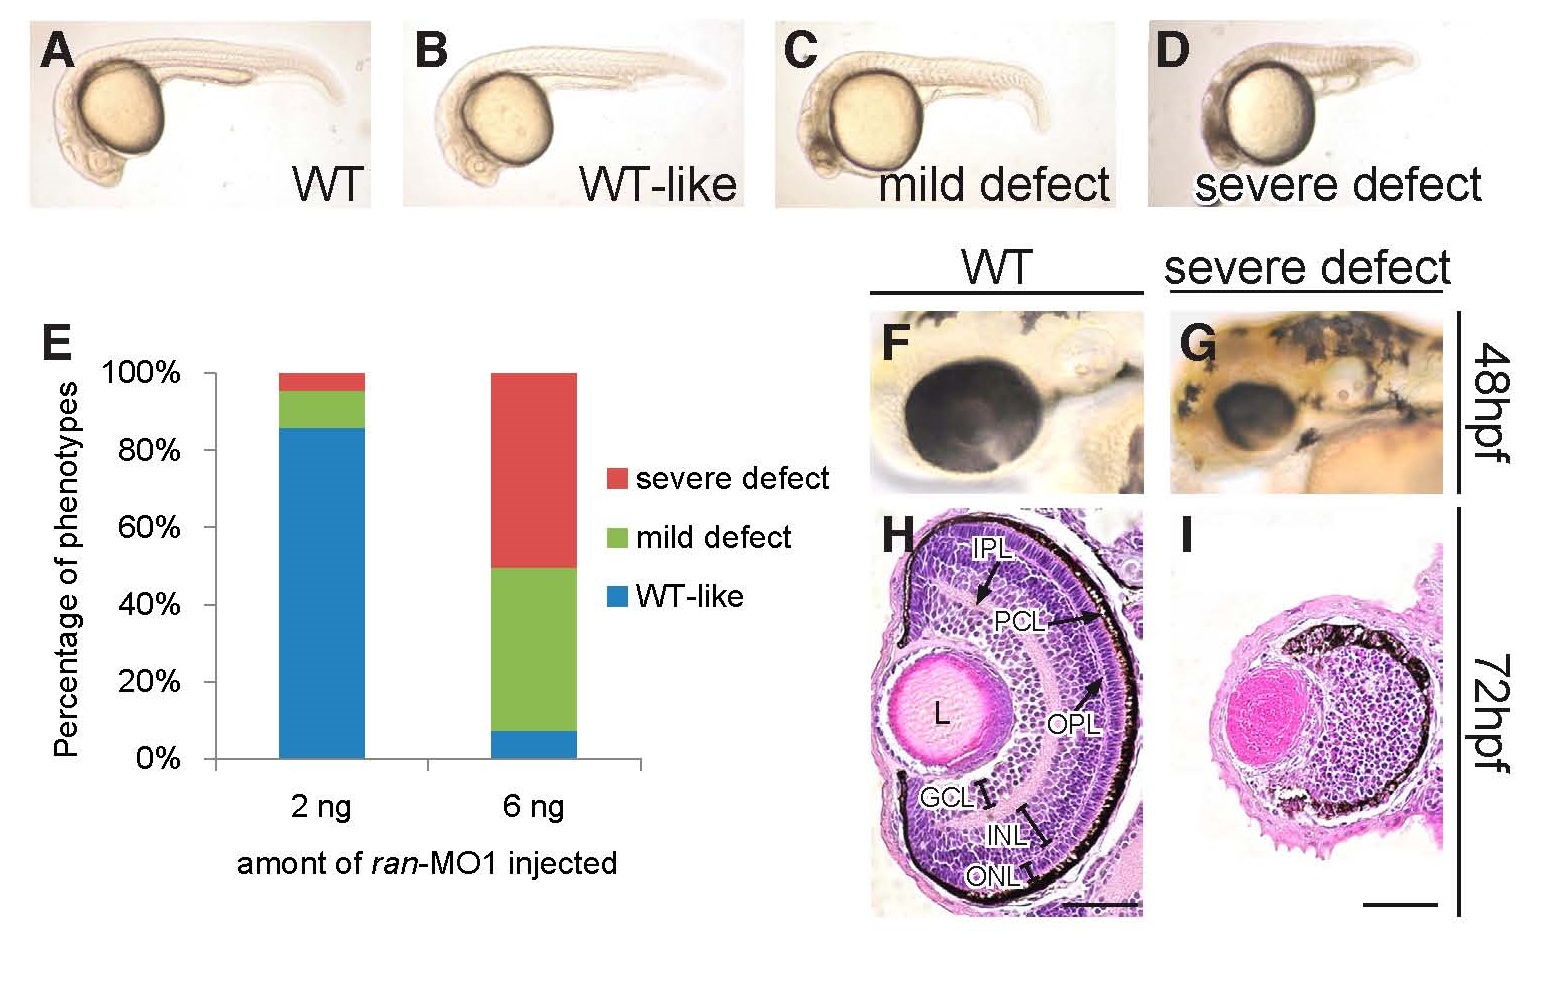
Fig. 2
The phenotypes of ran deficiency. (A-D) Typical phenotypes of live WT and ran-deficient embryos at 24 hpf. (E) The distribution of phenotypes when 2 ng and 6 ng of ran-MO1 were injected. The injection experiment was repeated three times with pooled n = 411 and 627 for 2 ng and 6 ng injection groups, respectively. (F-G) Typical images of live WT eye and the eye with severe ran-deficient phenotype at 48 hpf. All live embryo images are lateral view with anterior to the left. (H-I) H&E staining of WT eye and the eye with severe ran-deficient phenotype at 72 hpf. All H&E staining images are coronal sections with anterior to the top. GCL, ganglion cell layer; INL, inner nuclear layer; IPL, inner plexiform layer; ONL, outer nuclear layer; OPL, outer plexiform layer; PCL, pigment cell layer. Scale bars, 50 µm. All images of ran-deficient embryos were injected with 6 ng of ran-MO1. All images are representative of at least three repeats with pooled n>400.