
Image
|
Figure Caption
Fig. 2
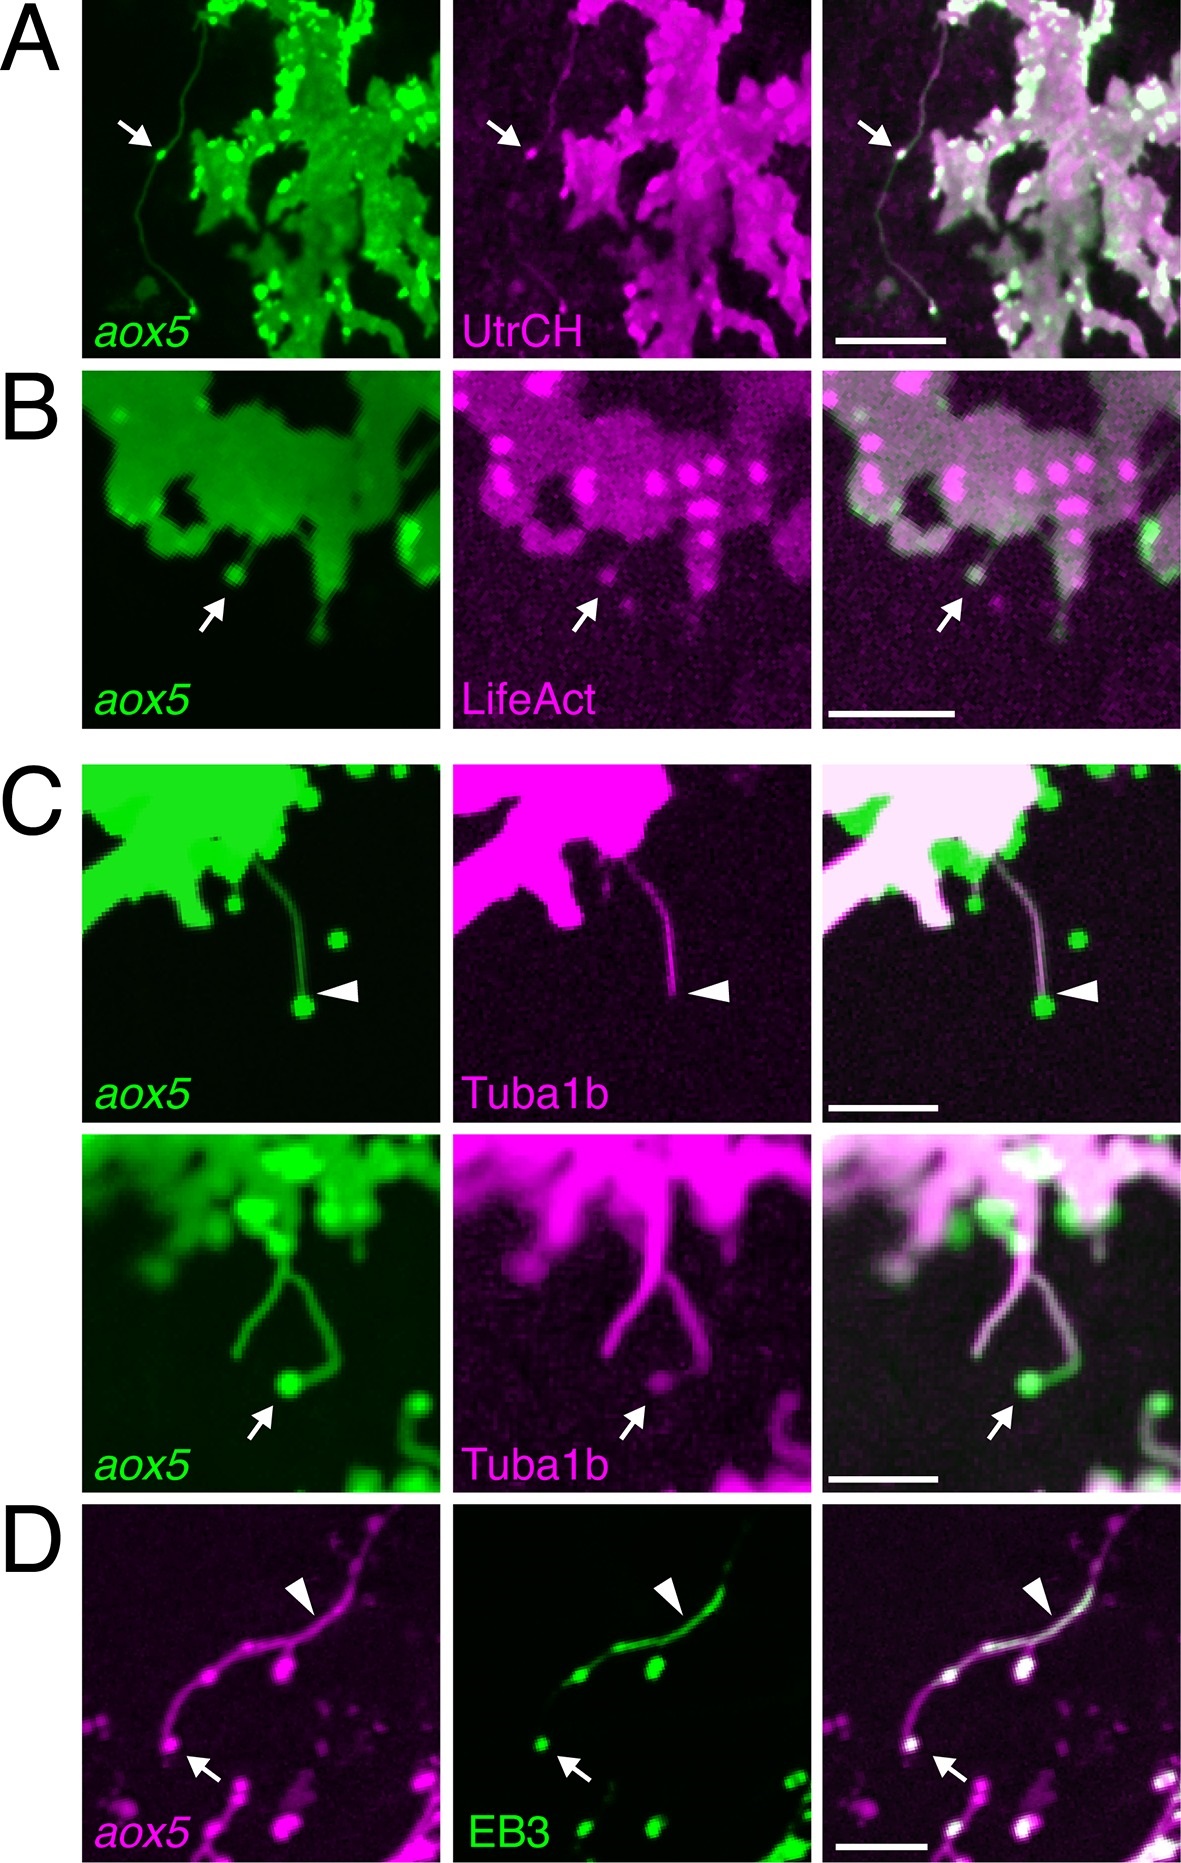
(A, B) aox5+ projections and puncta (arrowheads) labeled for F-actin, revealed by UtrCH-mCherry (A) and LifeAct-mKate (B). (C) Projections contained tubulin, as revealed by Tuba1b-mCherry. In some instances tubulin was absent from vesicles (arrowhead, upper) and in other instances was found in vesicles (arrow, lower). (D) Accumulations of microtubule end binding protein EB3 fused to GFP (arrowhead), were present in vesicles as well (arrow); aox5 here drives mCherry. Scale bars: 20 µm (A); 10 µm (B, C, D).
Figure Data
Acknowledgments
This image is the copyrighted work of the attributed author or publisher, and
ZFIN has permission only to display this image to its users.
Additional permissions should be obtained from the applicable author or publisher of the image.
Full text @ Elife