
|
Fig. 4
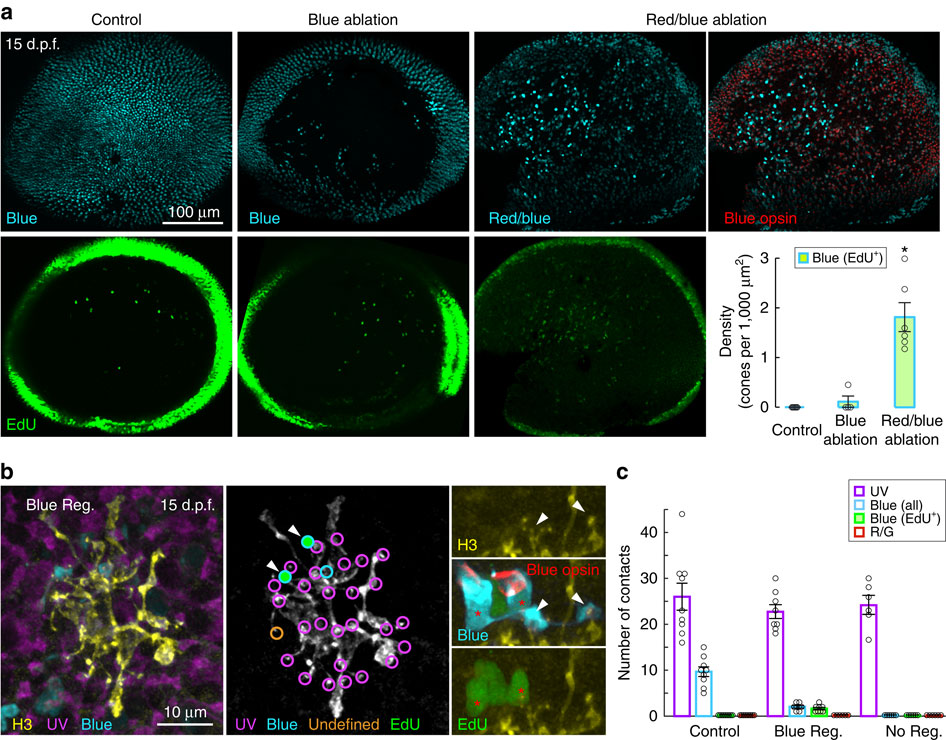
H3 HCs wire with regenerated population of blue cones. From
(a) Distribution of blue cones or red and blue cones in the whole-mount retinae at 15 d.p.f. Blue-cone-only ablation (B ablation) was performed using Tg(sws2:nfsB-mCherry), or blue and red cones were ablated (R/B ablation) together using Tg(sws2:nfsB-mCherry, thrb:gal4, clmc:GFP; UAS:nfsB-mCherry). Blue-opsin immunostaining (red) identified blue cones among red and blue cones that both express mCherry. EdU labelling is shown in green. Density of EdU+ blue cones are plotted for all conditions. Circles are values from individual retina. Error bars are s.e.m. *P=0.0022 for pair-wise comparisons with control or R/B ablation. P values are from Mann–Whitney rank-sum test. (b) An H3 HC in a retina with blue-cone regeneration (Blue Reg.) after red and blue-cone ablation at 5 d.p.f. using Tg(sws1:GFP, sws2:nfsB-mCherry, thrb:gal4, clmc:GFP; UAS:nfsB-mCherry) animals. Blue cones were identified by blue-opsin immunostaining (red). Dendritic tips (arrowheads) of the HC invaginated the EdU+ blue cones (red asterisks). (c) Quantification of ultraviolet and blue-cone contacts in retina in which red and blue cones were ablated. H3 HCs located in retinal regions lacking blue-cone regeneration (No Reg.) are grouped separately from H3 HCs that were located in areas containing regenerated blue cones (Blue Reg.). Red/green (R/G) cones identified by zpr1 immunostaining. Circles are values obtained from individual cells. Error bars are s.e.m. UV, ultraviolet.