
|
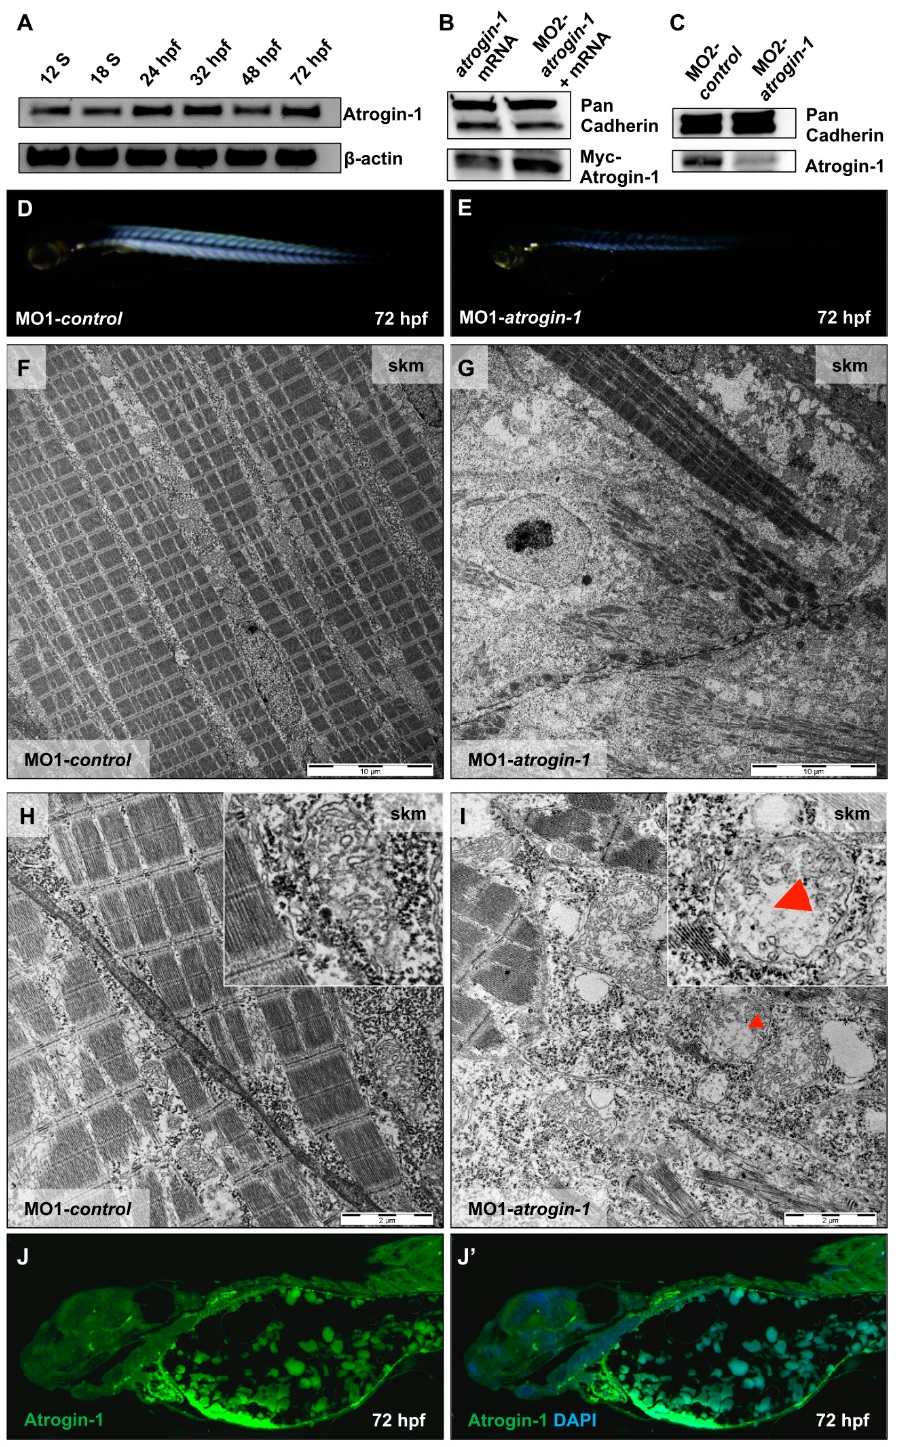
Fig. S1
(A) RT-PCR for atrogin-1 and β-actin on wild-type on zebrafish cDNA from 12-Somite stage (S) until 72 hpf; (B) Western blot analysis using an anti-Myc antibody after atrogin-1 mRNA and MO2-atrogin-1 + atrogin-1 mRNA injection; (C) Immunoblot analysis using an anti-Atrogin-1 antibody after MO1-control and MO2-atrogin-1 injection; (D,E) Lateral views of control injected (D) and MO1-atrogin-1 injected embryos (E) showing birefringence at 72 hpf; (F-I) Electron micrographs of skeletal muscle cells (skm) of Atrogin-1 morphants (G,I) and embryos injected with control Morpholino (F,H) at 72 hpf. (J,J′) Immunofluorescent staining against Atrogin-1 on paraffin sections, in lateral view of wild-type embryo at 72 hpf, nuclei are counterstained with DAPI.