
|
Fig. 6
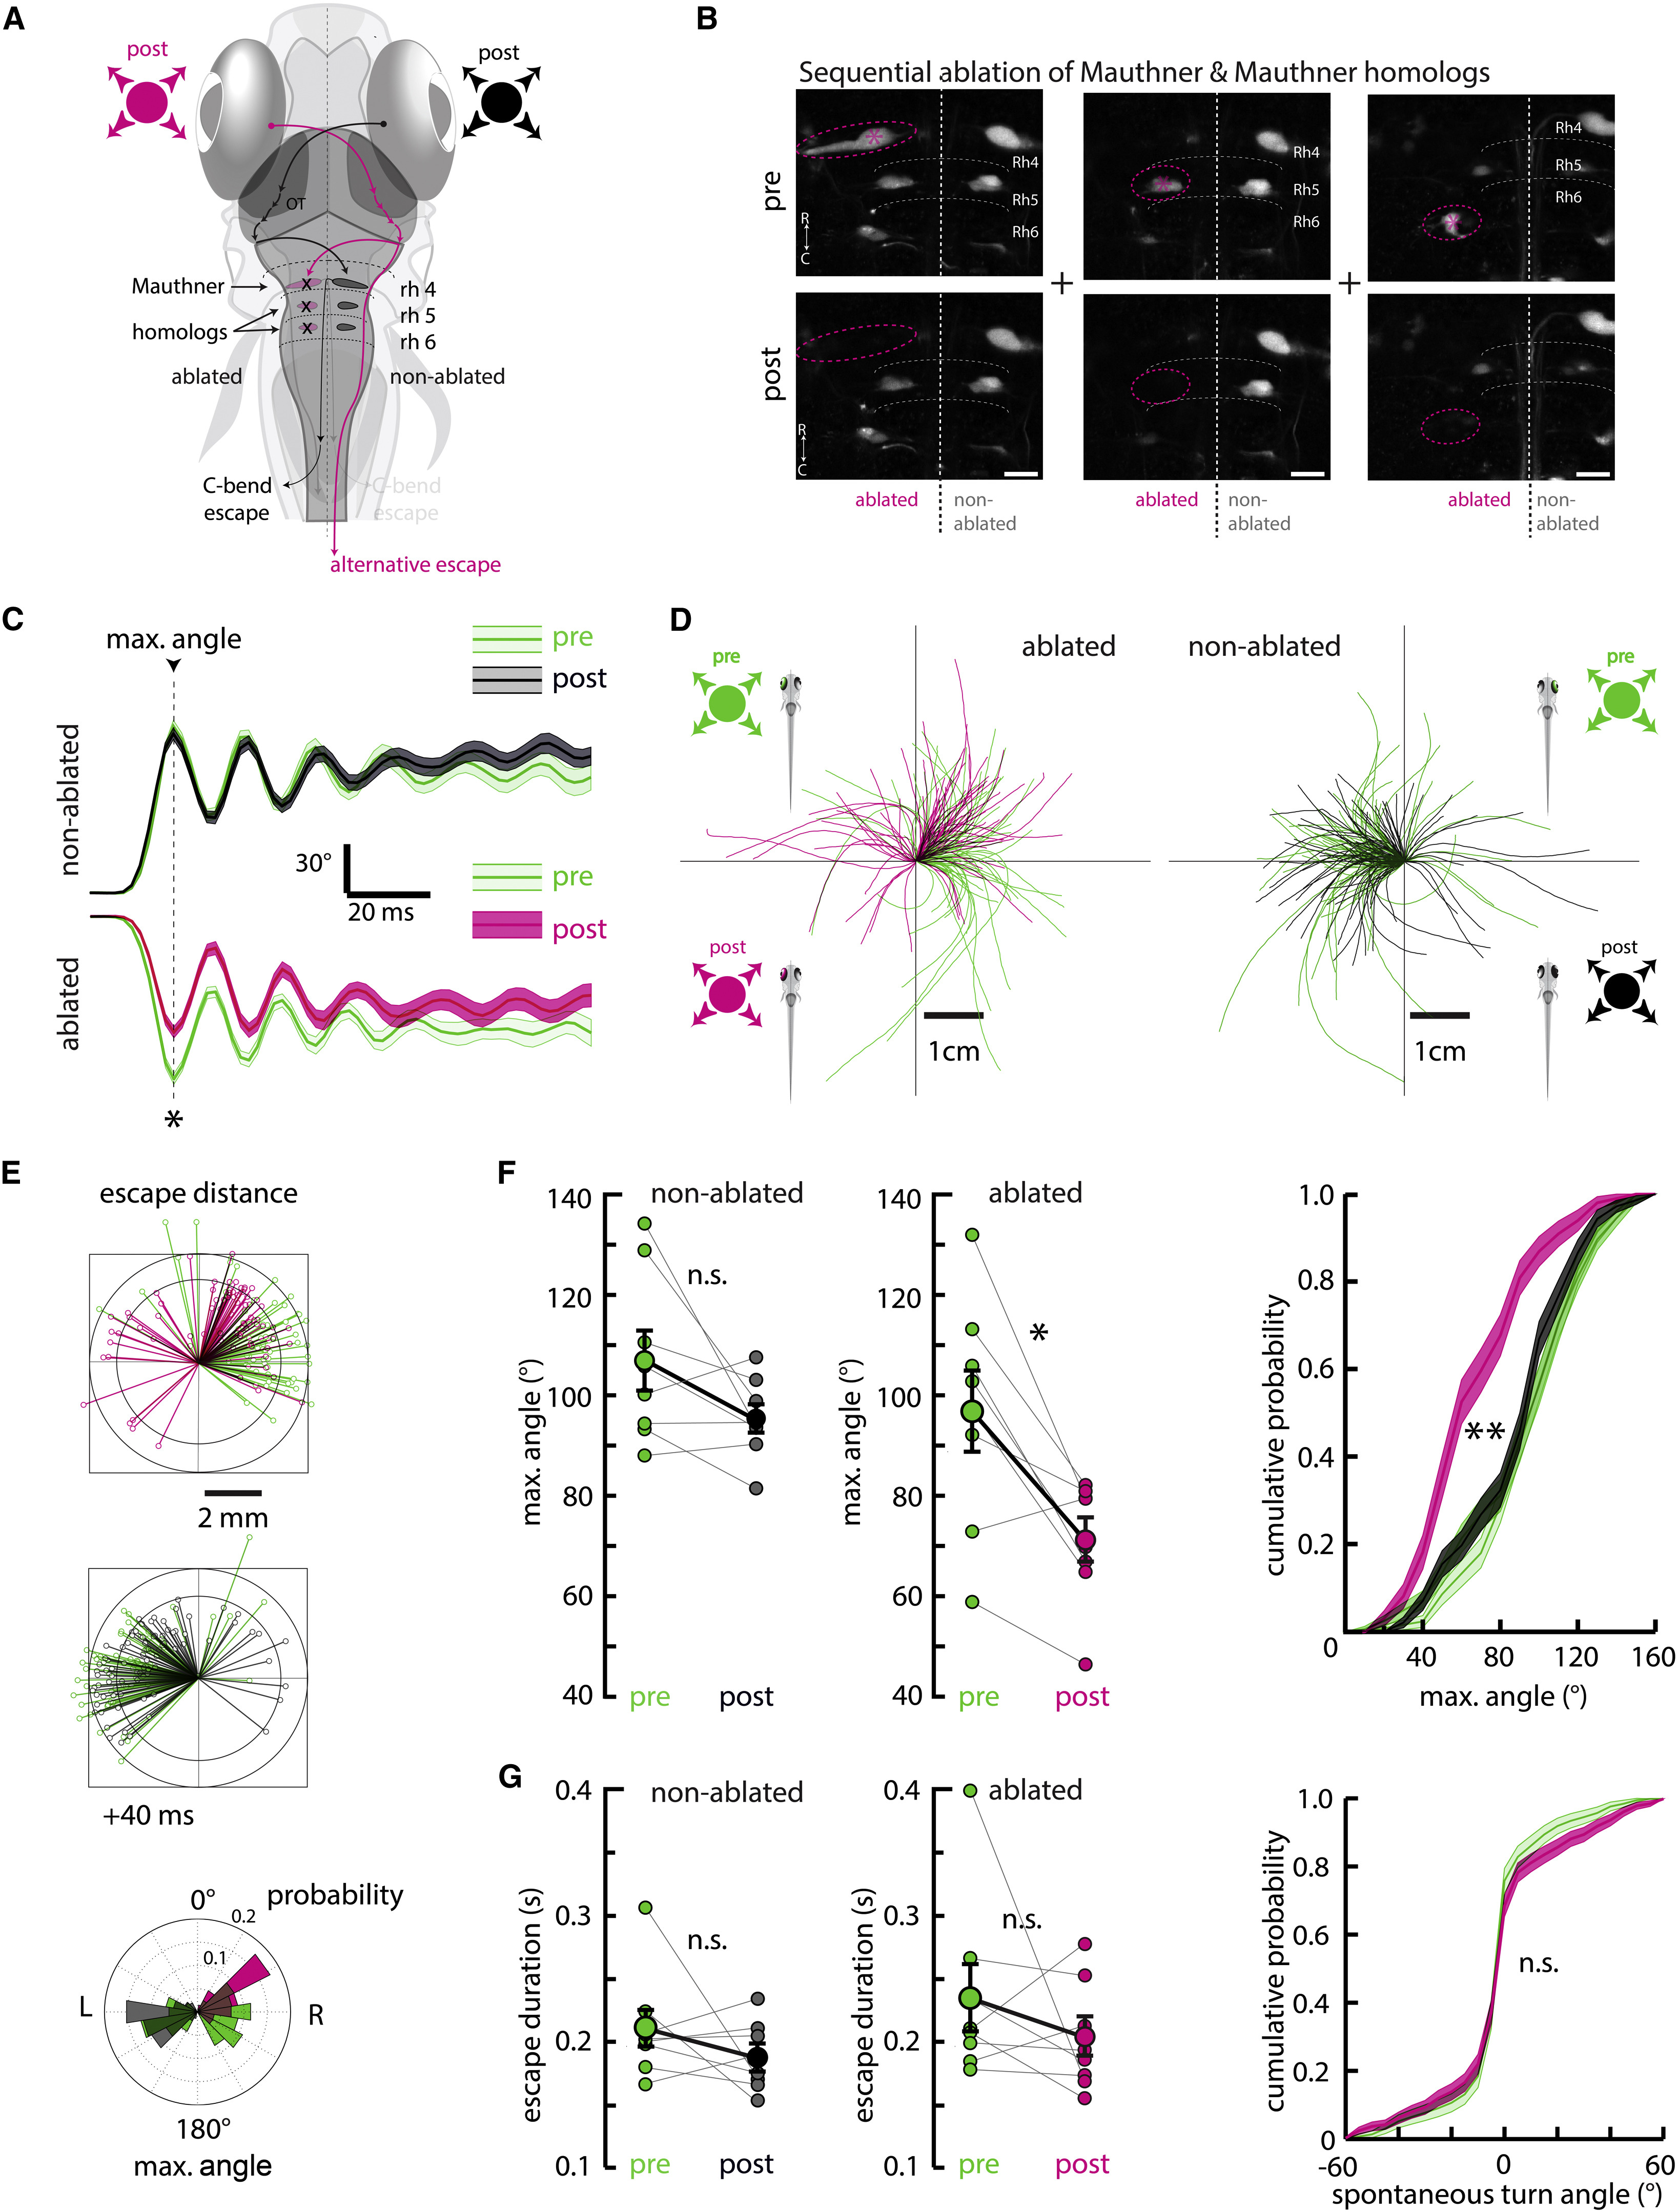
Laser Ablation of the Mauthner System Alters Escape Trajectory and Reduces Initial Bend Angle
(A) Schematic of the zebrafish brain and hypothesized information flow from the eye, through the contralateral OT, to the contralateral hindbrain Mauthner system (M-system) comprising the Mauthner cell (M-cell) and homologs in rhombomeres 4-6.
(B) Two-photon micrographs showing an example of the M-cell (left), MiD2 (center), and MiD3 (right) pre- and post-unilateral ablation. For each fish, the M-cell and MiD2/MiD3 clusters were ablated together. Ablations were specific to targeted neurons and did not affect nearby cells. Cells were backfilled with dextran-conjugated dye. Scale bar is 20 µm.
(C) The average maximum turn angle derived from orientation change, see Experimental Procedures, during escapes is significantly altered for maneuvers contralateral to the ablated side, with the largest change evident at the first (maximum) bend. The average escape ipsilateral to the ablated side remained unchanged. All traces are aligned to the time point of the first bend. Error is SEM across all events, N = 8 fish. Pre, non-ablated, n = 60 events; pre, ablated, n = 73; post, non-ablated, n = 88; post, ablated, n = 66. p = 0.002, permutation test.
(D) Left panel shows escape trajectories pre- and post-ablation (green and pink, respectively) elicited by stimuli ipsilateral to the ablated side. Right panels shows escape trajectories pre- and post-ablation (green and black, respectively) elicited by stimuli contralateral to the ablated side.
(E) Top panel shows stick diagrams representing fish position 40 ms after escape initiation for the ablated and non-ablated sides, pre- and post-ablation. The shift in escape trajectory post-ablation is more apparent on this timescale. Bottom panel is an angular histogram of the maximum turn angle pre- and post-ablation for the ablated and non-ablated sides.
(F) Left panel shows quantification of maximum turn angle across fish pre- and post-ablation for the ablated and non-ablated sides. *p = 0.002, n.s., p = 0.093, permutation test. Right panel shows that this change is also apparent in histograms of maximum turn angle across all events; **p < 10-5 ablated side, p = 0.175 non-ablated side, permutation test across all events. Error is bootstrapped SEM.
(G) Left panel shows quantification of escape duration. No significant change is apparent on either side after ablation. Non-ablated, p = 0.073. Ablated, p = 0.101, permutation test. Error bars are SEM across fish. Right panel shows the distribution of spontaneous turns does not change after ablation, providing further evidence of ablation specificity; pre-ablation n = 744, post-ablation n = 911 spontaneous swim events; n.s., p = 0.725, permutation test. Error is bootstrapped SEM.