
|
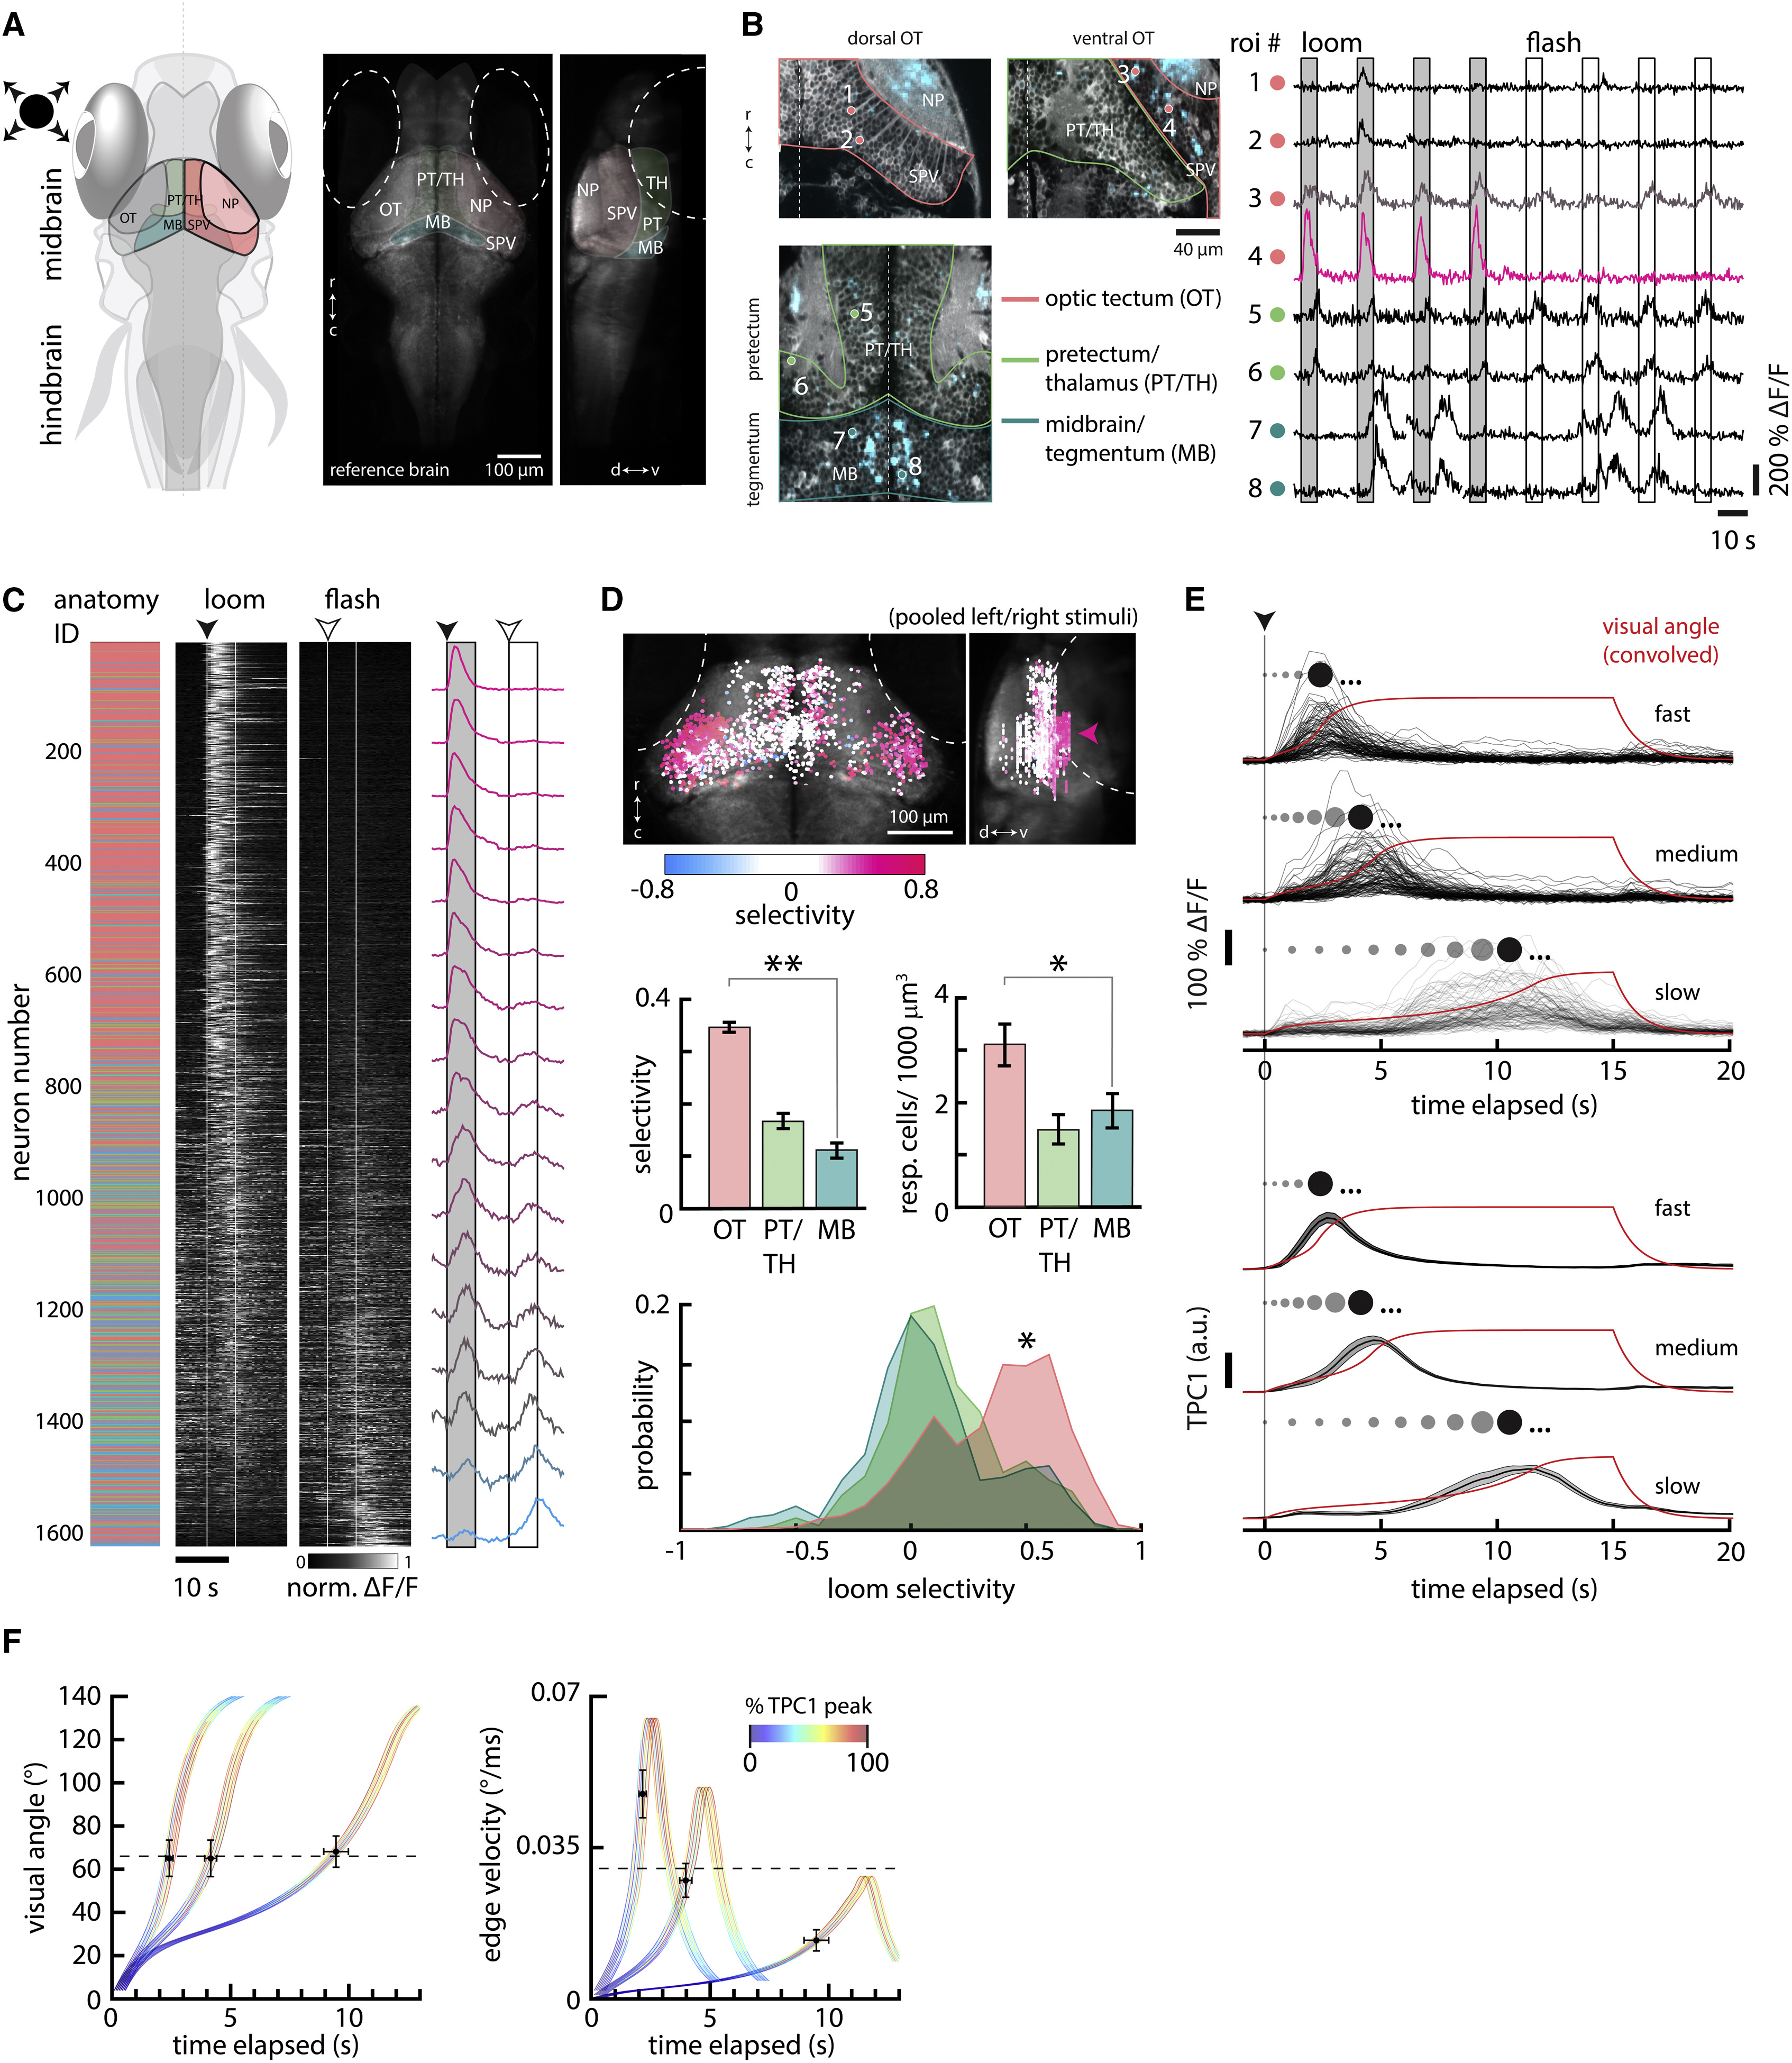
Fig. 3
Looming-Specific Neurons in the Optic Tectum Encode Critical Size
(A) Left panel is a schematic of the larval zebrafish brain indicating the positions of the optic tectum (OT) with its (neuropil (NP) and cell body layers (stratum periventriculare, or SPV), the pretectum/thalamus (PT/TH), and the midbrain tegmental region (MB). The right panels depict a transverse average intensity projection of a 5-dpf Tg(elavl3:GCaMP2) larval brain (used as an anatomical reference) and accompanying sagittal view. TH, thalamus; PT, pretectum. Dotted lines denote the position of each eye: r, rostral; c, caudal; d, dorsal; and v, ventral.
(B) Left panels depict single planes showing anatomy (gray) and activity (blue) in the dorsal and ventral OT, PT/TH, and MB. Individual region of interest (ROI) numbers (ROIs shown as colored circles) correspond to the traces on the right, which illustrate the general pattern of activity observed across midbrain visual areas in response to looming stimuli. Neurons in the dorsal OT (1 and 2) respond weakly to looming stimuli. Neurons in the ventral OT (3 and 4) show more varied responses but typically respond strongly to and favor looming stimuli. Neurons in PT/TH (5 and 6) respond to both looming and flashed stimuli. Neurons in MB (7 and 8) were typically active spontaneously and non-stimulus-locked. Boxes represent stimulus presentation periods. Traces are re-ordered and concatenated from longer recordings.
(C) The middle panels show trial-averaged normalized ΔF/F evoked by looming and flashed stimuli from 1,613 active neurons across 12 fish. Each neuron is sorted according to its selectivity index (see Experimental Procedures) in descending order (1 = looming exclusive, -1 = flash exclusive). The left-most panel shows the corresponding anatomical location of each neuron, color-coded as in (B). The right-most panel shows the average normalized ΔF/F binned across 100 neurons from the sorted list. Traces are normalized to [0 1] after trial averaging. Normalization values were skewed to the right (maximum 586.24%ΔF/F, minimum 21.02%ΔF/F, and skewness 1.28). Dotted lines and boxes represent stimulus presentation periods, with start times indicated by arrowheads.
(D) The top panel depicts all neurons from (C) mapped to a reference brain and colored according to selectivity index. Arrowhead shows the preponderance of looming-selective neurons in the ventral OT. Differences in the number of OT neurons between the left and right hemispheres reflects a sampling bias (data from stimuli presented in the left and right visual fields were pooled); most OT imaging was unilateral. The middle panel shows bar plots quantifying mean selectivity (left) and responsive cell density (right) across the OT (n = 60 imaging planes), PT (n = 34), and MB (n = 44). In the bottom panel, histograms show the distribution of looming selectivity across neurons in the OT (n = 973 cells), PT (n = 279), and MB (n = 361). **p < 10-5, *p < 0.01, permutation test. N = 12 larvae. r, rostral; c, caudal; d, dorsal; and v, ventral.
(E) Top shows the responses of 110 OT neurons in one fish to looming stimuli simulating approach at three different velocities (R/V 545 ms, 1,090 ms, and 2,730 ms, top to bottom). The stimulus size (angle) over time for each condition, convolved with a calcium impulse response function (CIRF) (τ = 962 ms), is shown in red. Bottom shows the first temporal principal component (TPC1, ± SEM across fish) averaged over eight fish, 1,533 neurons. The spots above each trace schematize the size of the looming stimulus before the TPC1 threshold (dark spot). Stimuli continue to expand (ellipses) until the end of the stimulus epoch.
(F) Quantifications of average convolved stimulus visual angle (left) and edge velocity (right) at TPC1 threshold times (81% TPC1 response after normalization to maximum across all stimulus conditions) for all three velocity conditions. The colored curves show the convolved stimulus size and edge velocity for each condition, fanned to show TPC1 dynamics for individual fish. Each color value corresponds to the normalized amplitude of TPC1 activity during expansion. Crosses show the average value of each stimulus variable at the TPC1 threshold for each velocity condition. Error bars are SEM for TPC1 threshold timing (horizontal) and respective stimulus variables (vertical) across fish. Dotted lines represent the mean visual angle and edge velocity at TPC1 threshold across all fish and conditions.