
|
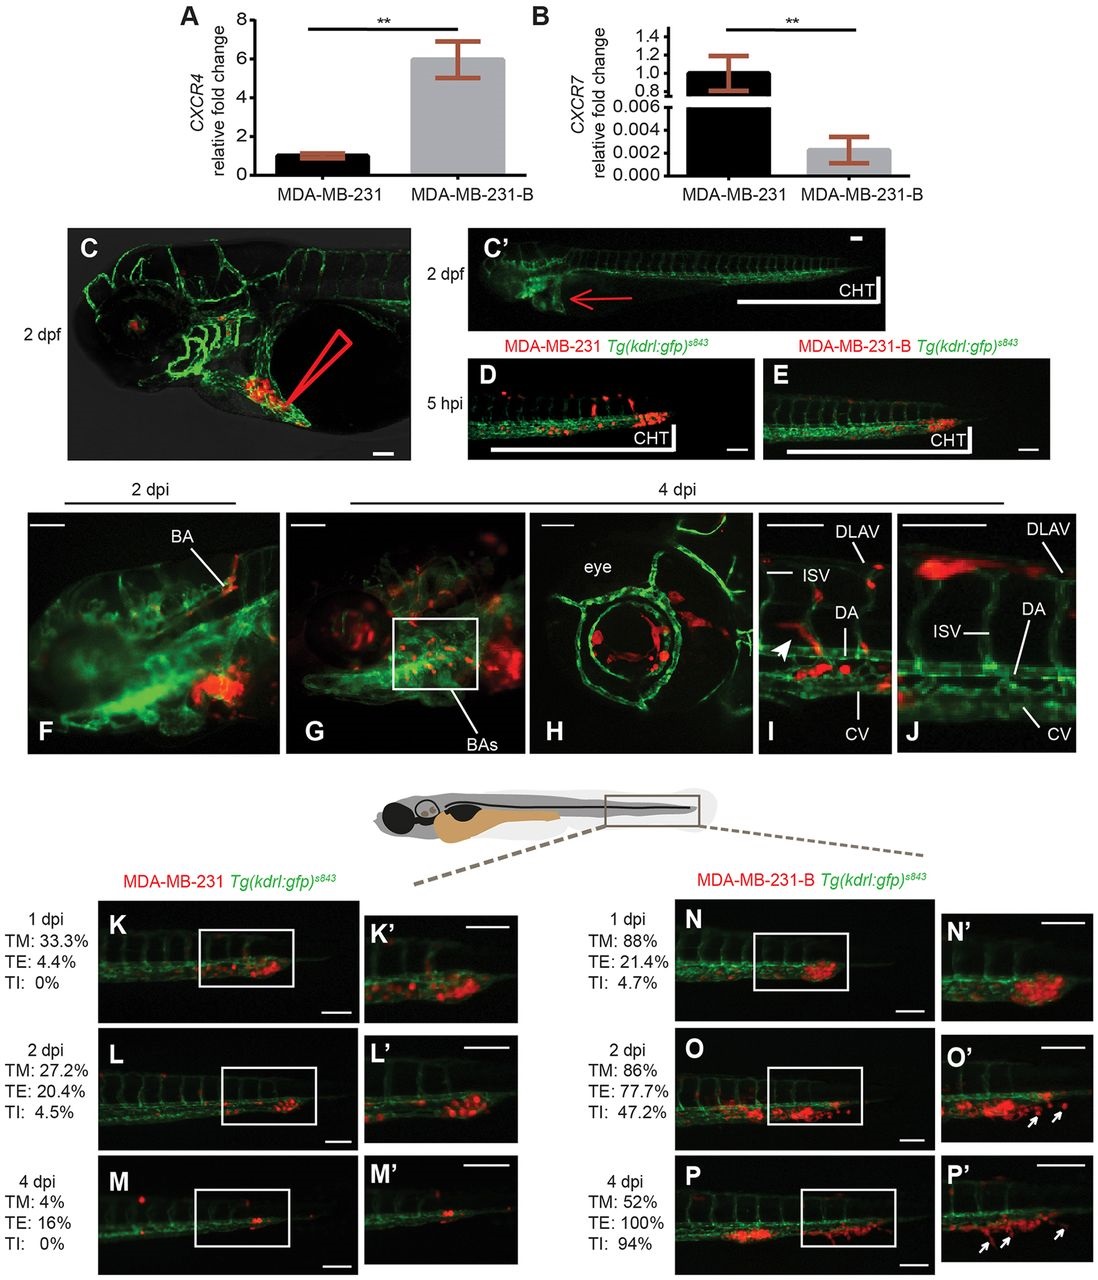
Fig. 1
CXCR4 expression levels correlate with metastatic potential in a zebrafish xenotransplantation model. The bone clone (MDA-MB-231-B) expressed higher levels of CXCR4 mRNA (A) and lower levels of CXCR7 mRNA (B), compared to the parental cell line MDA-MB-231, originated from metastatic triple-negative breast cancer (TNBC) [unpaired t-test, (A) **P=0.0016, (B) **P=0.0019]. Upon engraftment into the duct of Cuvier (C,C′ red arrow) of 2-dpf zebrafish embryos (C′), MDA-MB-231 circulated in the vascular system (D), in a comparable manner to MDA-MB-231-B (E). Arrowhead in C represents the site of injection. CHT, caudal hematopoietic tissue. (F-J) Tumor cells disseminated throughout the embryo, in the head (F-H), the eye (H), the trunk and the tail (I,J), and extended filopodia at vessel branching points (I, arrowhead). BA, basilar artery; BAs, branchial arches; CV, caudal vein; DA, dorsal aorta; DLAV, dorsal longitudinal anastomotic vessel; ISV, intersegmental vessel. (K-P′) Over time, a weaker phenotype was detectable for the MDA-MB-231 cell line (K-M,K′-M′), whereas evident secondary tumor mass formation, extravasation and tail fin invasion persisted when MDA-MB-231-B cells were implanted (N-P,N′-P′). Arrows in O′ and P′ indicate invasive cancer cells that are not in contact with the endothelium and are found in the tail fin tissue, after extravasation. Images were acquired using a Leica TCS SPE confocal microscope with an HC PL FLUOTAR 10× DRY objective (0.30 N.A.) in panel C and with an HC APO 20× DRY objective (0.7 N.A.) in panel H. All other images were acquired using a Leica MZ16FA fluorescent microscope coupled to a DFC420C camera. Scale bars: 50µm. Phenotype assessment was carried out at 1, 2 and 4dpi, evaluating the ability of both cell lines to form a secondary tumor mass, to extravasate and to invade the surrounding tail fin. Images are representative of embryos injected with MDA-MB-231 and number of individuals was n=51 (5hpi) (D), 45 (1dpi) (K), 44 (2dpi) (L) and 25 (4dpi) (M) or with MDA-MB-231-B and number of individuals was n=44 (5hpi) (E), 42 (1dpi) (N), 36 (2dpi) (O) and 34 (4dpi) (P). Percentages relative to tumor mass (TM), tumor extravasation (TE) and tumor invasion (TI) are reported for each stage, for both MDA-MB-231 and MDA-MB-231-B cell lines.