
|
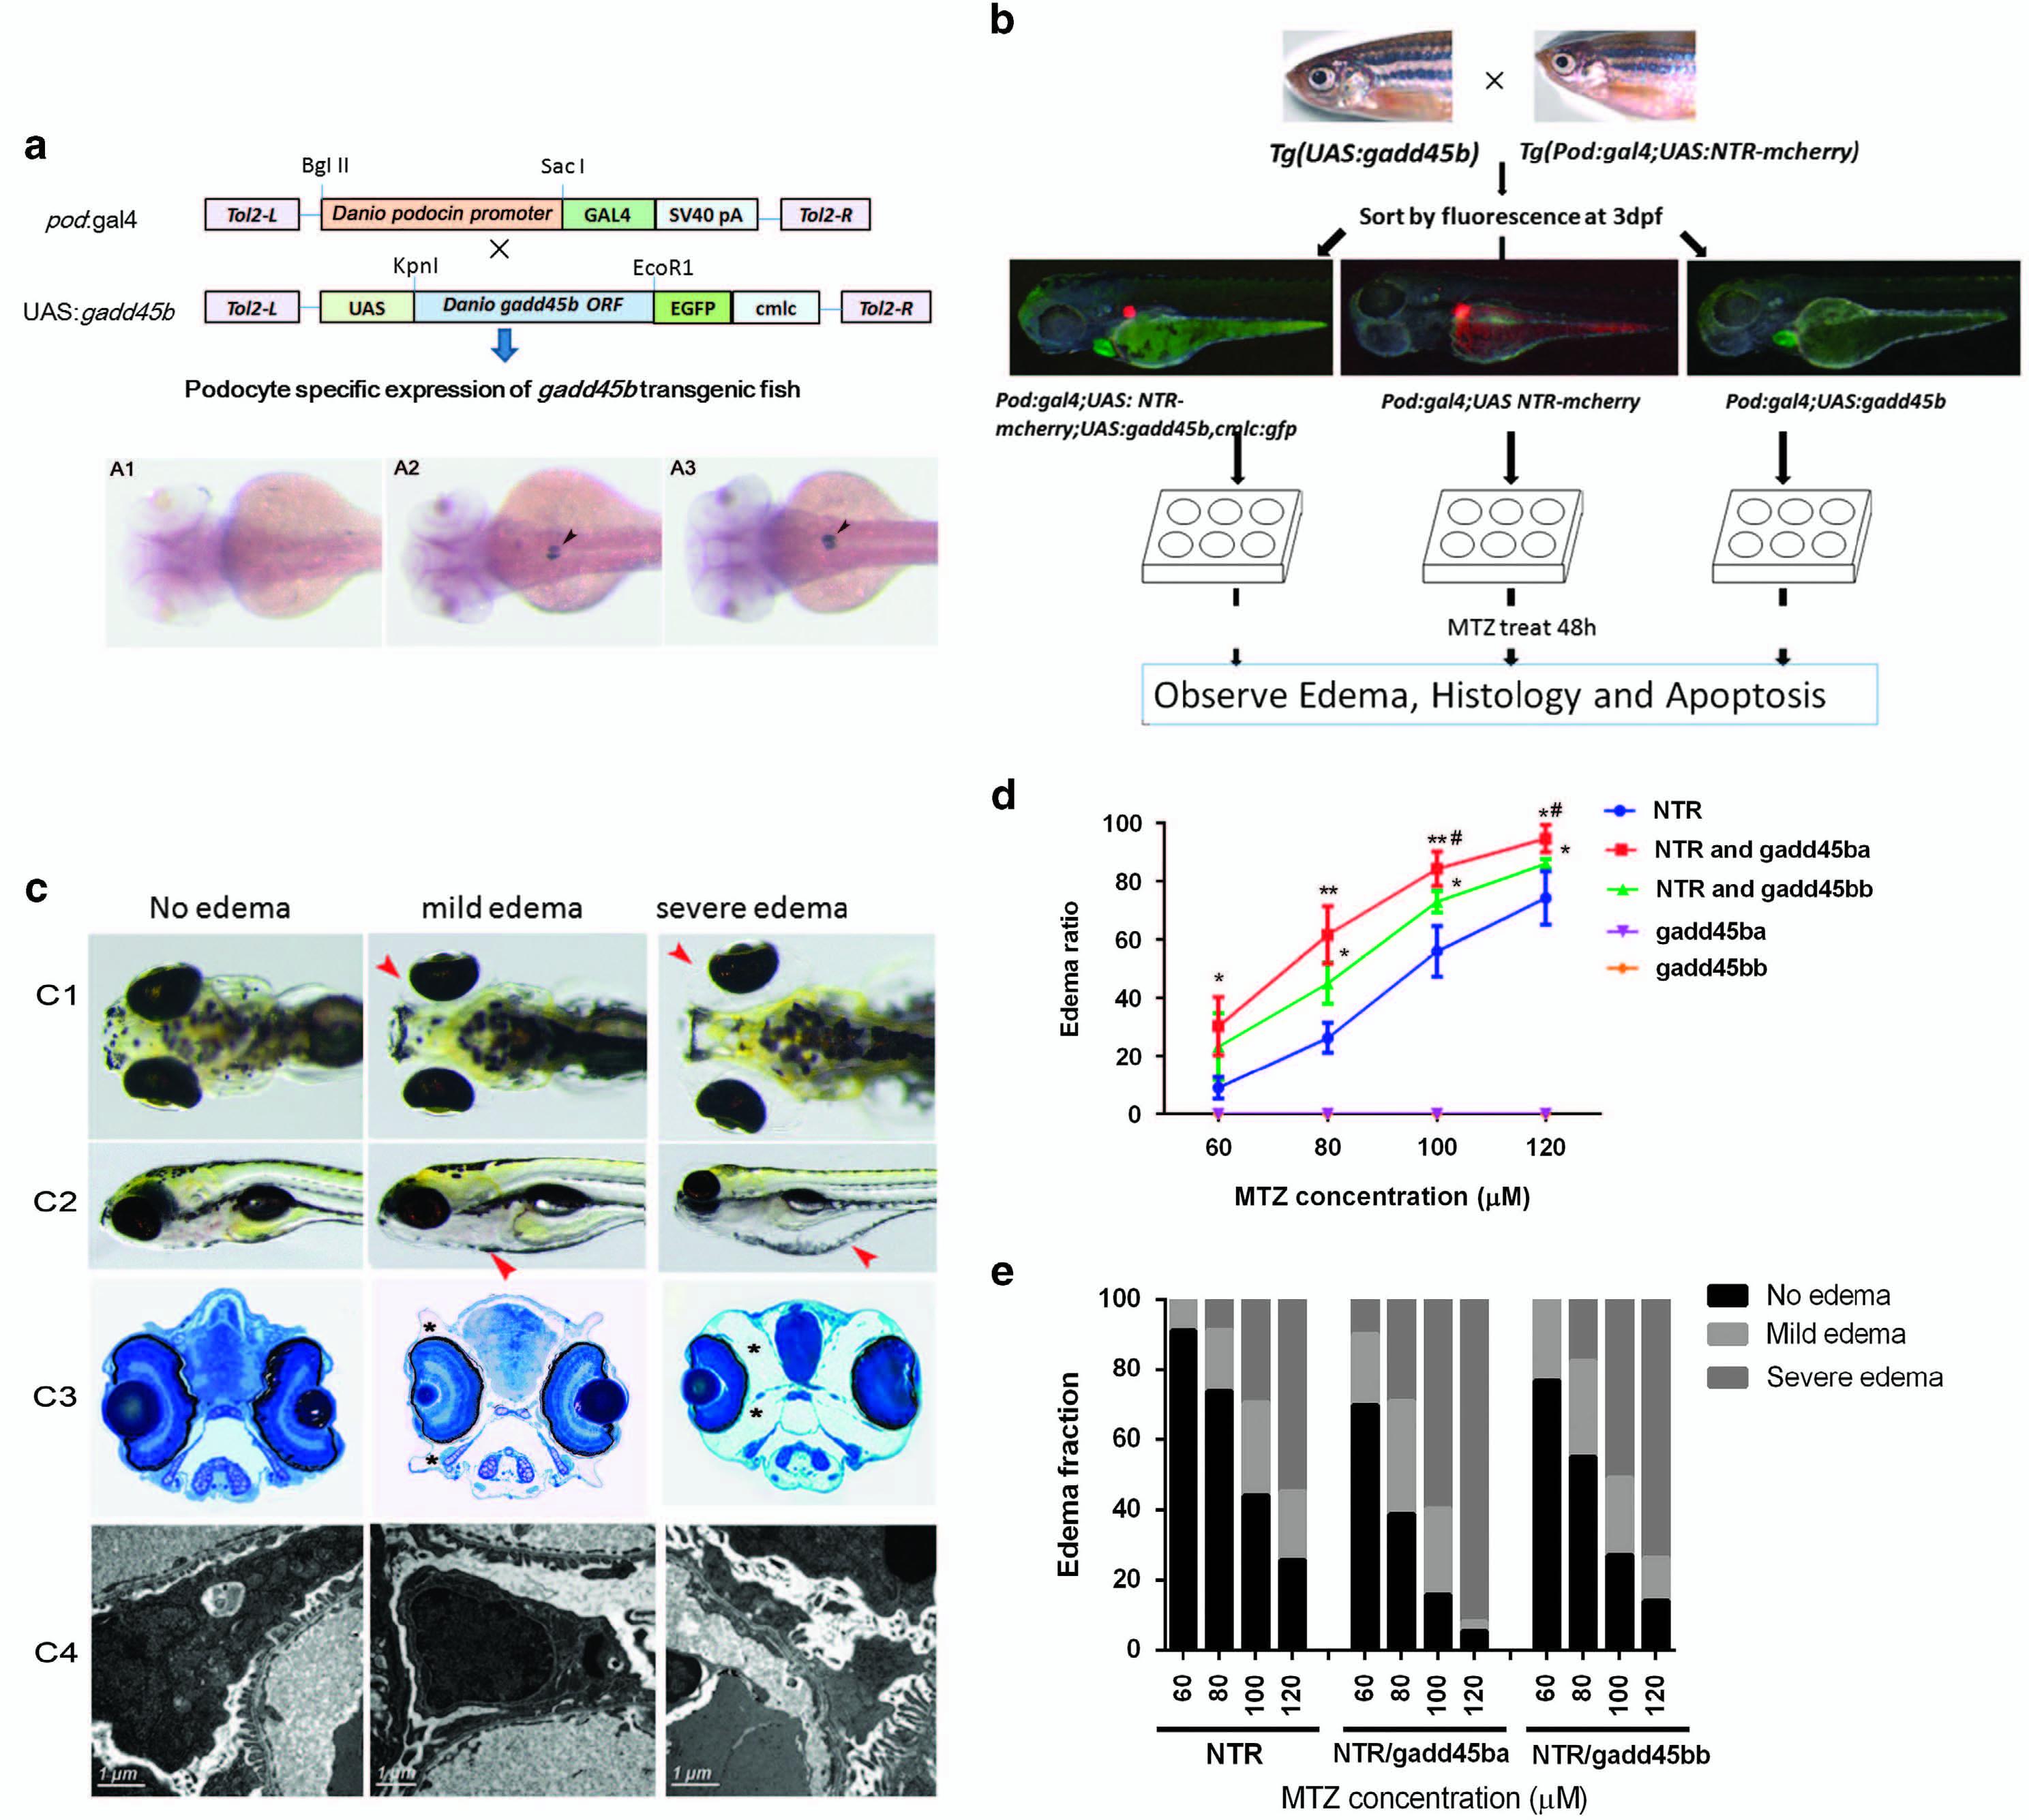
Fig. 3
gadd45ba/b overexpression in podocytes aggravates MTZ-induced podocyte injury. (a) Schematic graph showing the generation of transgenic fish. Podocyte-specific expression of gadd45ba/b is confirmed by in situ hybridization in WT (A1), Tg (pod:Gal4,UAS:gadd45ba) (A2) and Tg (pod:Gal4,UAS:gadd45bb) (A3) at 3dpf. (b) Experimental scheme to test gadd45ba/b overexpression on MTZ-induced podocyte injury. (c) Representative figures showing the phenotypes due to MTZ-induced podocyte injury. (c1) Dorsal view of five dpf larvae showing periorbital edema (red arrowhead). (c2) side view of five dpf larvae showing whole-body edema (red arrowhead). (c3) Cross-section of eyes of five dpf larvae stained with methylene blue showing the severity of periorbital edema (asterisks). (c4) TEM showing the degree of foot-process effacement. (d) Quantitation of the percentage of larvae with periorbital edema. The nonfluorescence fish were used as negative controls and had no observable periobital edema phenotypes after being treated with MTZ. (e) Quantitation of the percentage of larvae with mild and severe edema. Results are represented as mean±S.D. (n=3), *P<0.05, **P<0.01 versus NTR group, #P<0.05 versus NTR and gadd45bb group