
|
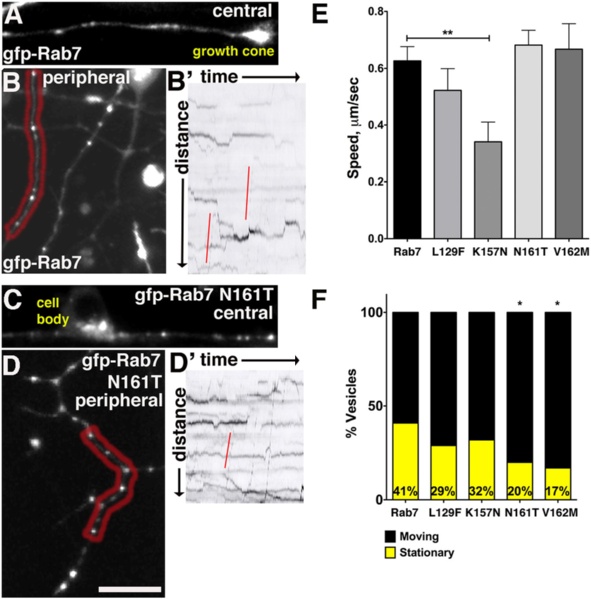
Fig. 7
In vivo imaging of CMT2b Rab7 mutant containing vesicles reveals changes in endosome dynamics. a-b Confocal images of neurons with GFP-Rab7 labeled endosomes in central (a) and peripheral (b) axons. b′ Kymograph of peripheral RB axon in red region in (b). Red lines indicate rapid retrograde vesicle runs. c-d Confocal images of neurons with GFP-Rab7 N161T expressing endosomes in central (c) and peripheral (d) axons. d′ Kymograph of peripheral axon in red region in (d). Red line indicates rapid retrograde vesicle runs. e Speeds of vesicles containing Rab7 K157 mutants were significantly reduced in central and peripheral axons. **p = 0.009, Unpaired, two-tailed t-test. Wildtype Rab7 control: n = 97 vesicles in 8 cells in 6 embryos; Rab7 L129F: n = 37 vesicles in 6 cells in 4 embryos; Rab7 K157N: n = 24 vesicles in 3 cells in 2 embryos; Rab7 N161T n = 73 vesicles in 8 cells in 6 embryos; Rab7 V162M n = 33 vesicles in 5 cells in 3 embryos. f Decreased percentage of stationary vesicles in central and peripheral axons expressing Rab7 N161T and V162M mutants. *p = 0.01, Fisher’s exact test. Wildtype Rab7 control: n = 39 vesicles in 8 cells in 6 embryos; Rab7 L129F: n = 86 vesicles in 6 cells in 4 embryos; Rab7 K157N: n = 37 vesicles in 3 cells in 2 embryos; Rab7 N161T n = 137 vesicles in 8 cells in 6 embryos; Rab7 V162M n = 60 vesicles in 5 cells in 3 embryos