
Image
|
Figure Caption
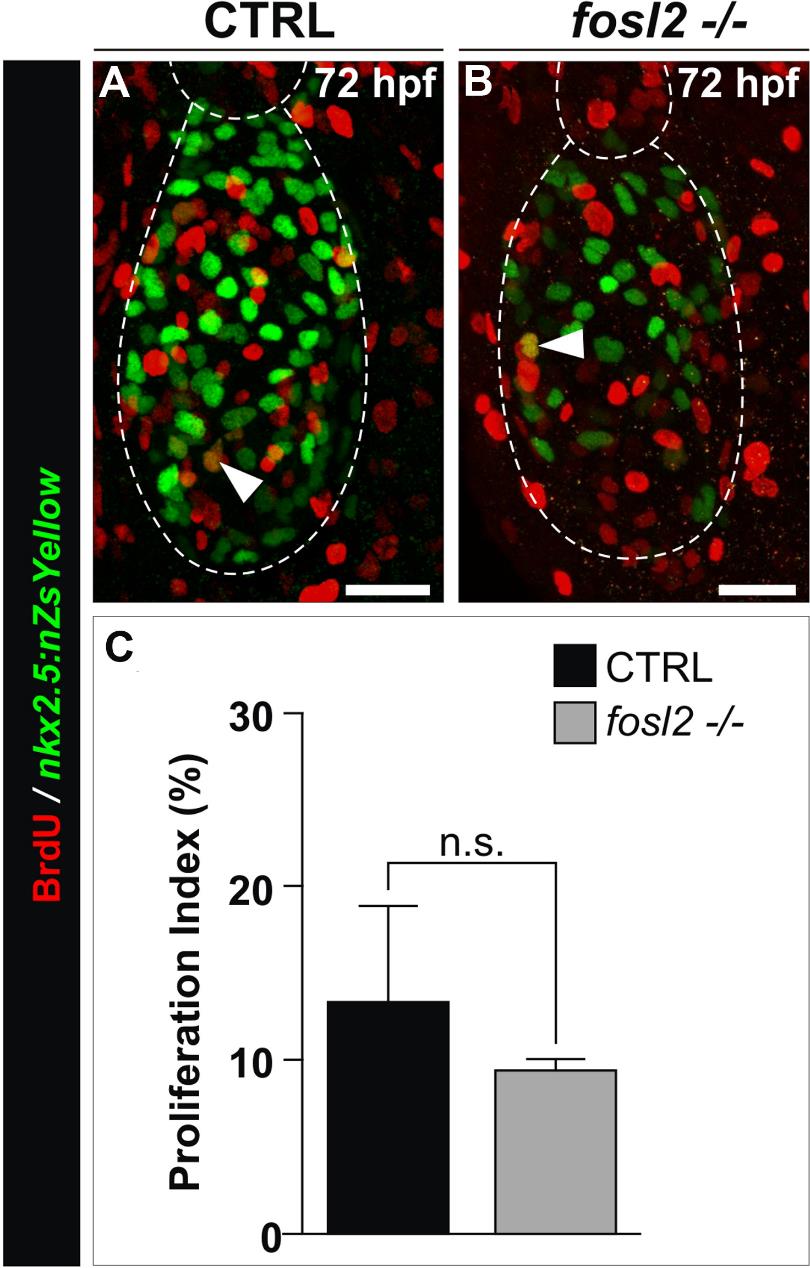
Fig. S8
Analysis of ventricular cardiomyocyte proliferation in fosl2-/- animals.
(A,B) Confocal images of 72 hpf control sibling (CTRL; A, n=5) and fosl2fb16-/- (B; n=4) Tg(nkx2.5:ZsYellow-nuc) embryos exposed to BrdU between 48 hpf and 72 hpf and double immunostained for ZsYellow protein (green) and BrdU (red). The arrows highlight double positive nuclei. (C) Bar graph showing the average percentages of ZsYellow+ ventricular nuclei that were BrdU+. Error bars represent one standard deviation. n.s., not significant. Scale Bars: 25µm.
Acknowledgments
This image is the copyrighted work of the attributed author or publisher, and
ZFIN has permission only to display this image to its users.
Additional permissions should be obtained from the applicable author or publisher of the image.
Full text @ Development