
Image
|
Figure Caption
Fig. S2
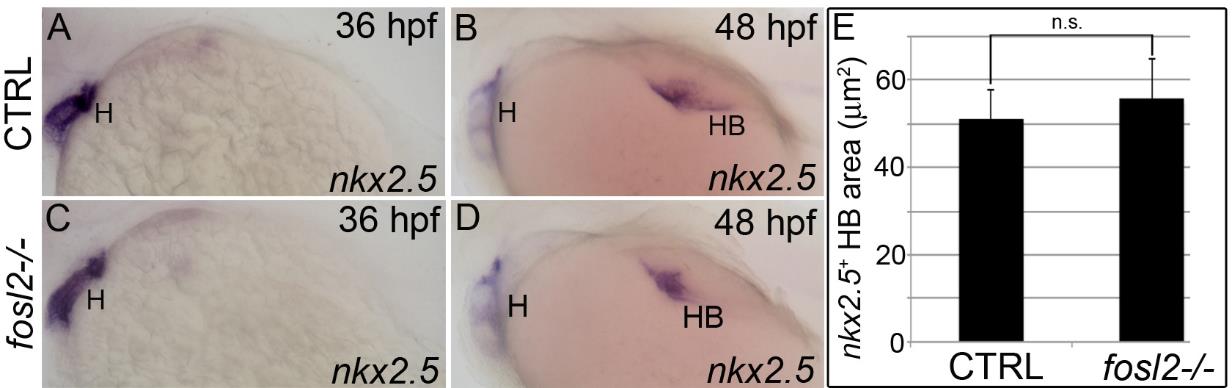
Hepatobiliary morphogenesis proceeds at a normal rate between 36 hpf and 48 hpf in fosl2 mutants.
(A-D) In situ hybridization analysis of nkx2.5 transcripts in control sibling (CTRL; A,B) and fosl2- /- (C,D) embryos at 36 hours post fertilization (hpf) (A, C; n=>9 embryos) and 48 hpf (B,D). (E) Bar graph showing the average sizes of the nkx2.5 signal in 48 hpf control (n=18) and mutant (n=26) embryos. Error bars represent one standard deviation. n.s., not significant. H, heart. HB, hepatobiliary system.
Acknowledgments
This image is the copyrighted work of the attributed author or publisher, and
ZFIN has permission only to display this image to its users.
Additional permissions should be obtained from the applicable author or publisher of the image.
Full text @ Development