
IMAGE
Fig. 9 S1
- ID
- ZDB-IMAGE-160217-33
- Publication
- Yokota et al., 2015 - Endothelial Ca(2+) oscillations reflect VEGFR signaling-regulated angiogenic capacity in vivo
- All Figures
- Figures for Yokota et al., 2015
Image
|
Figure Caption
Fig. 9 S1
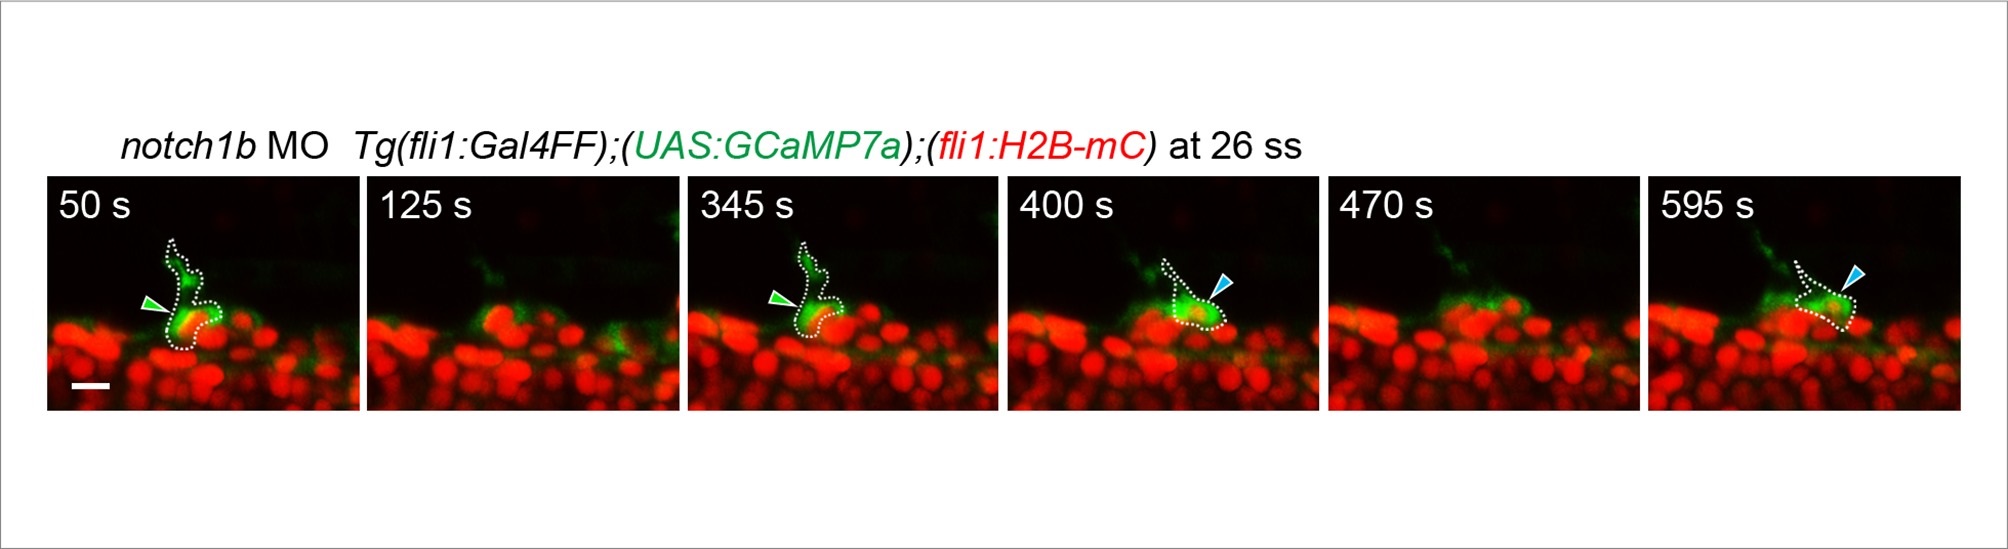
Ca2+ oscillations were maintained in two neighboring ECs in notch1b morphants during tip cell budding from the DA.
3D-rendered time-sequential images of Tg(fli1:Gal4FF);(UAS:GCaMP7a);(fli1:H2B-mC) embryos during tip cell budding injected with notch1b MO (26 ss). Green and blue arrowheads indicate the two neighboring Ca2+-oscillating ECs, both of which are budding from the DA. Scale bar, 10 mm.
Acknowledgments
This image is the copyrighted work of the attributed author or publisher, and
ZFIN has permission only to display this image to its users.
Additional permissions should be obtained from the applicable author or publisher of the image.
Full text @ Elife