
|
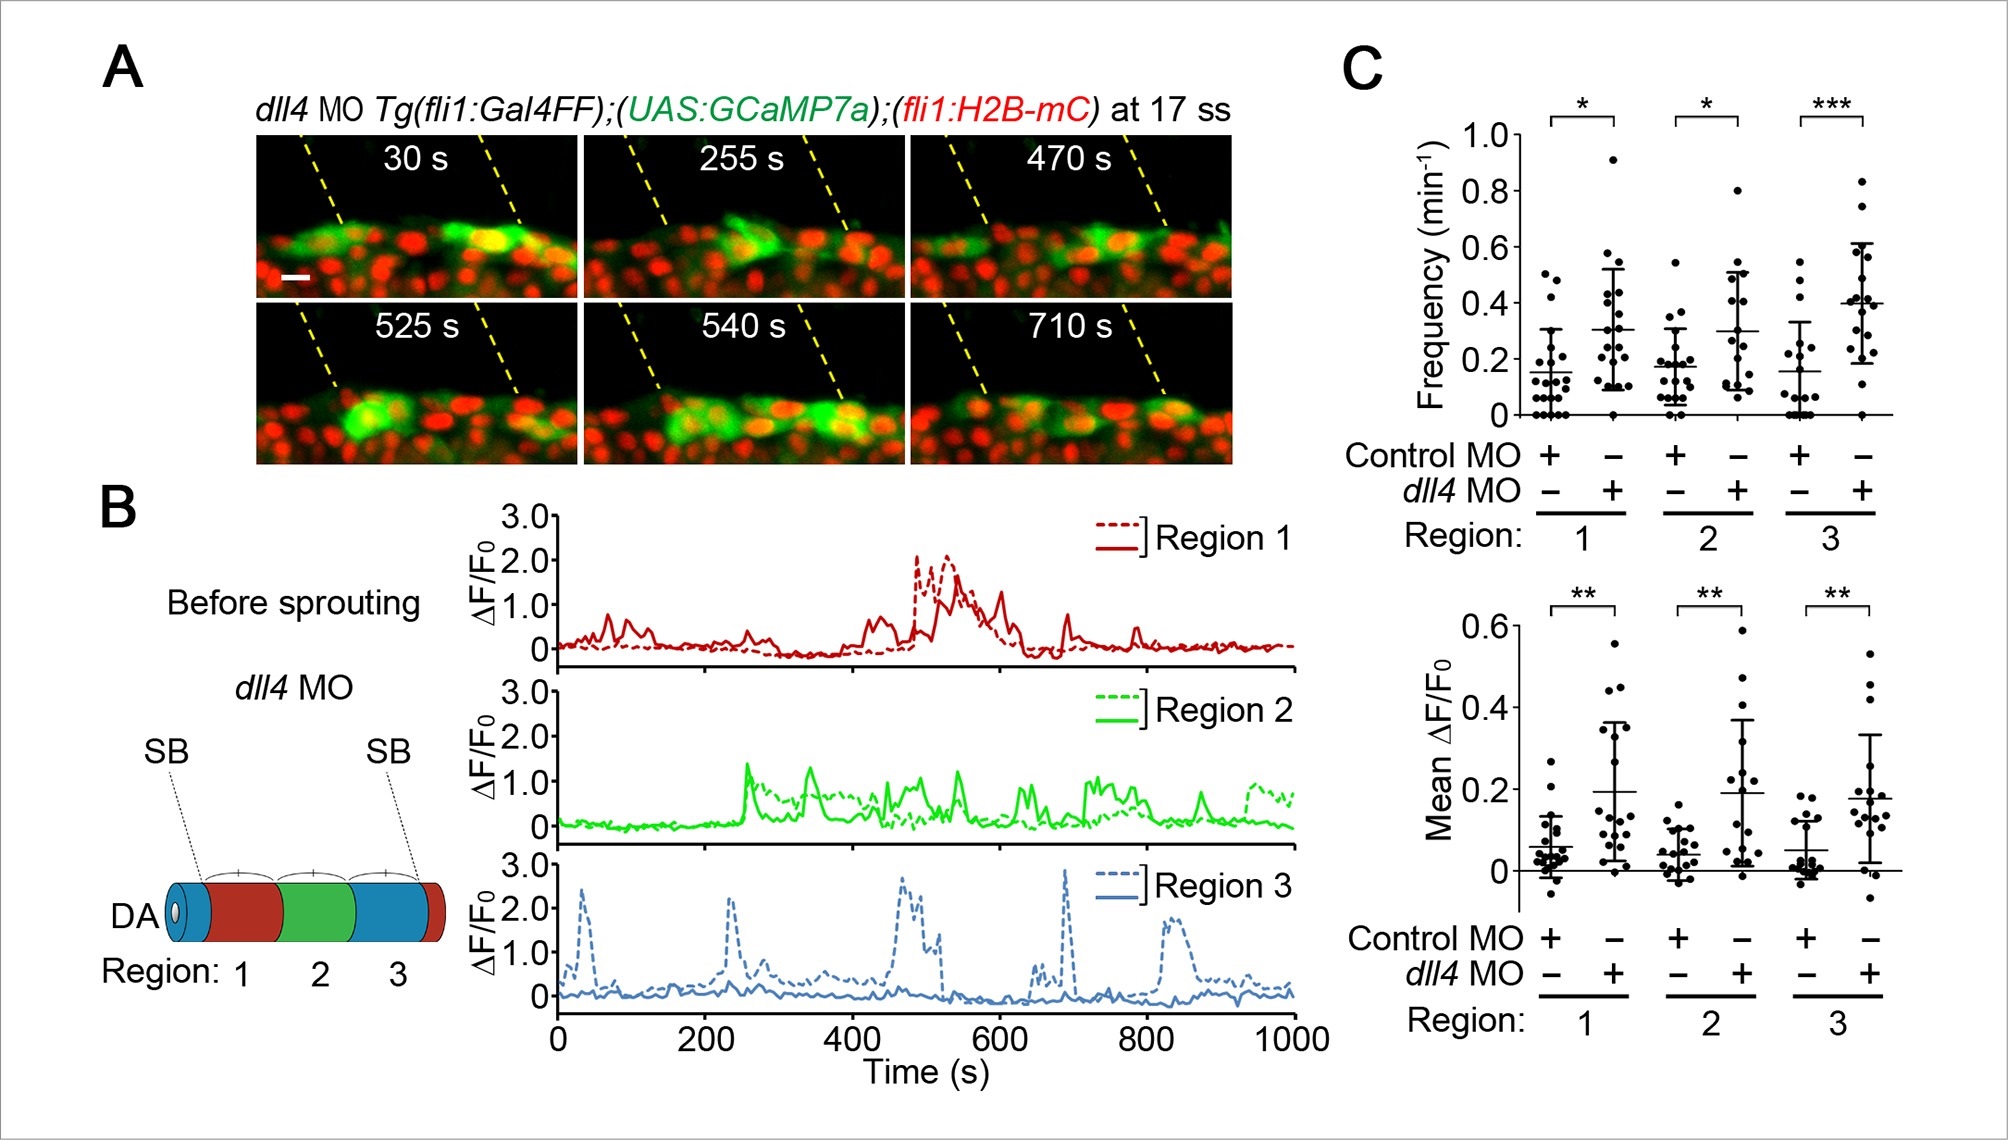
Fig. 8
Dll4 attenuates Ca2+ oscillations in the entire DA before ISV sprouting.
(A) 3D-rendered time-sequential images of Tg(fli1:Gal4FF);(UAS:GCaMP7a);(fli1:H2B-mC) embryos before ISV sprouting injected with dll4 MO (17 ss). Yellow dashed lines indicate positions of somite boundaries. (B) The DA is subdivided into three regions (Region 1–3) as illustrated in the scheme (left). The fluorescence changes in GCaMP7a (ΔF/F0) of individual ECs from A are shown as separated graphs (Region 1–3) as in Figure 3B. A representative graph of two ECs at each region is shown. (C) Quantification of Ca2+ oscillation frequency (upper) and mean ΔF/F0 (lower) in ECs of the indicated regions within the DA in control MO- or dll4 MO-injected embryos before vessel sprouting (17–19 ss). Horizontal lines represent mean ± s.d. (n e 16). Scale bar, 10 mm in A. *p < 0.05, **p < 0.01, ***p < 0.001. DA, dorsal aorta.