
|
Fig. 6
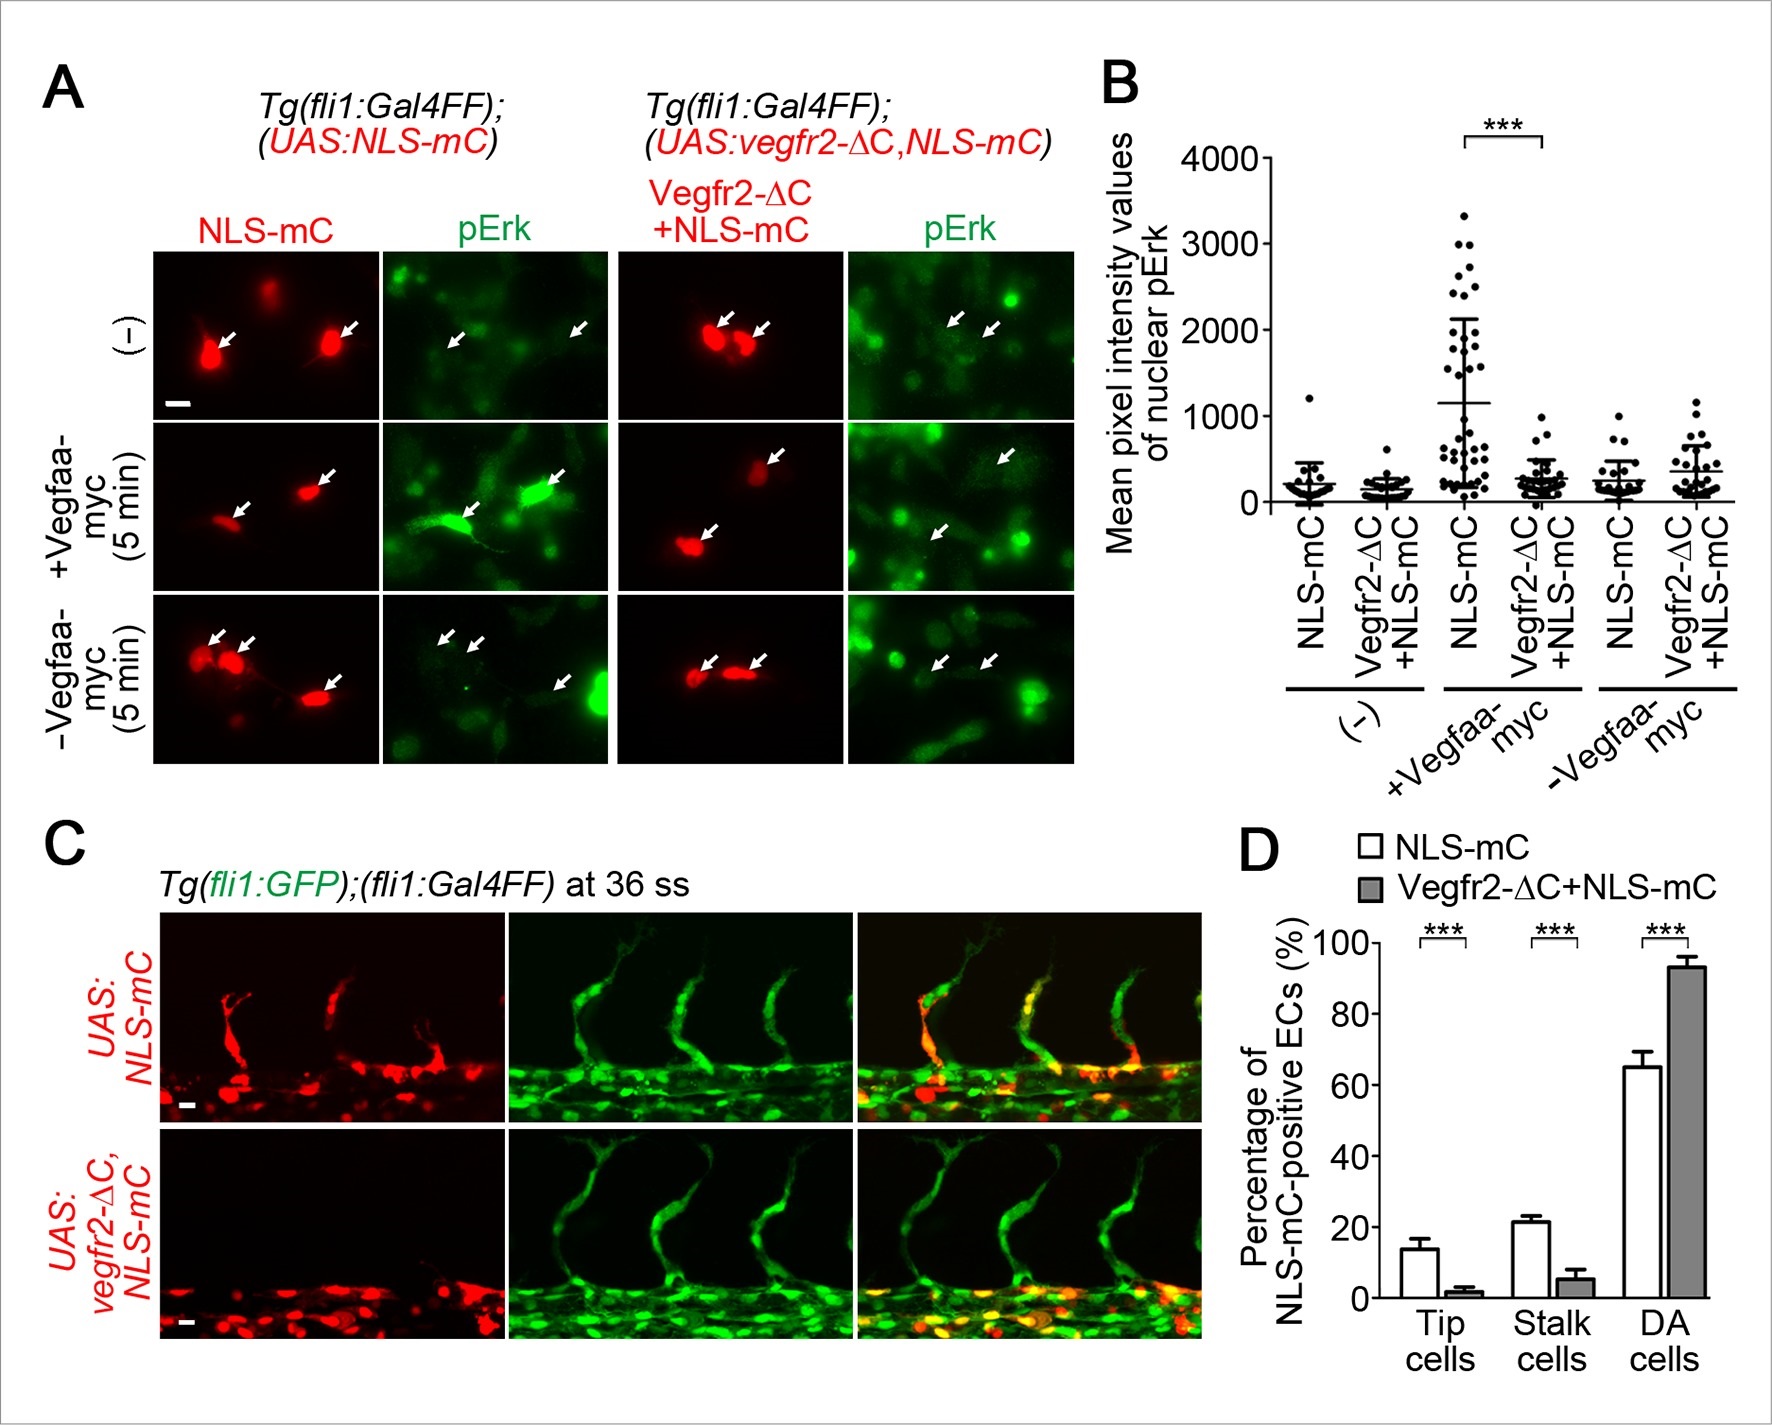
Iinitial tip cell selection in the DA.
(A) The cells dissociated from Tg(fli1:Gal4FF);(UAS:NLS-mC) or Tg(fli1:Gal4FF);(UAS:Vegfr2-ΔC,NLS-mC) embryos (34 hpf) cultured on laminin-coated dish were kept untreated (-) or treated for 5 min with the supernatants from HEK293T cells transfected with (+) or without (-) Vegfaa-myc. The cells were immunostained with anti-phospho-Erk (pErk) antibody. mC images (red) and pErk images (green) are shown. Arrows indicate NLS-mC-positive ECs. (B) Quantitative analyses by the results of A are shown as dot-plot graphs depicting mean pixel intensity values with ± s.d. of nuclear pErk in NLS-mC-positive ECs. Each dot represents the value of single cell (n > 20). Similar results were obtained in four independent experiments. (C) Confocal stack fluorescence images of Tg(fli1:GFP);(fli1:Gal4FF) embryos at 36 ss injected with control UAS:NLS-mC plasmid (upper) or UAS:Vegfr2-ΔC,NLS-mC plasmid (lower) which drives the expression of NLS-mC or both Vegfr2-ΔC and NLS-mC simultaneously in ECs in a mosaic manner, respectively. (D) By counting the numbers of NLS-mC-positive ECs constituting tip cells, stalk cells, and DA cells as observed in C in an embryo, the percentage of each group among total number of NLS-mC-positive ECs is indicated. The data are derived from five independent experiments, in each of which e 26 NLS-mC-positive cells were measured. Scale bars, 10 µm in A and C. ***p < 0.001.