
Image
|
Figure Caption
Fig. 5 S1
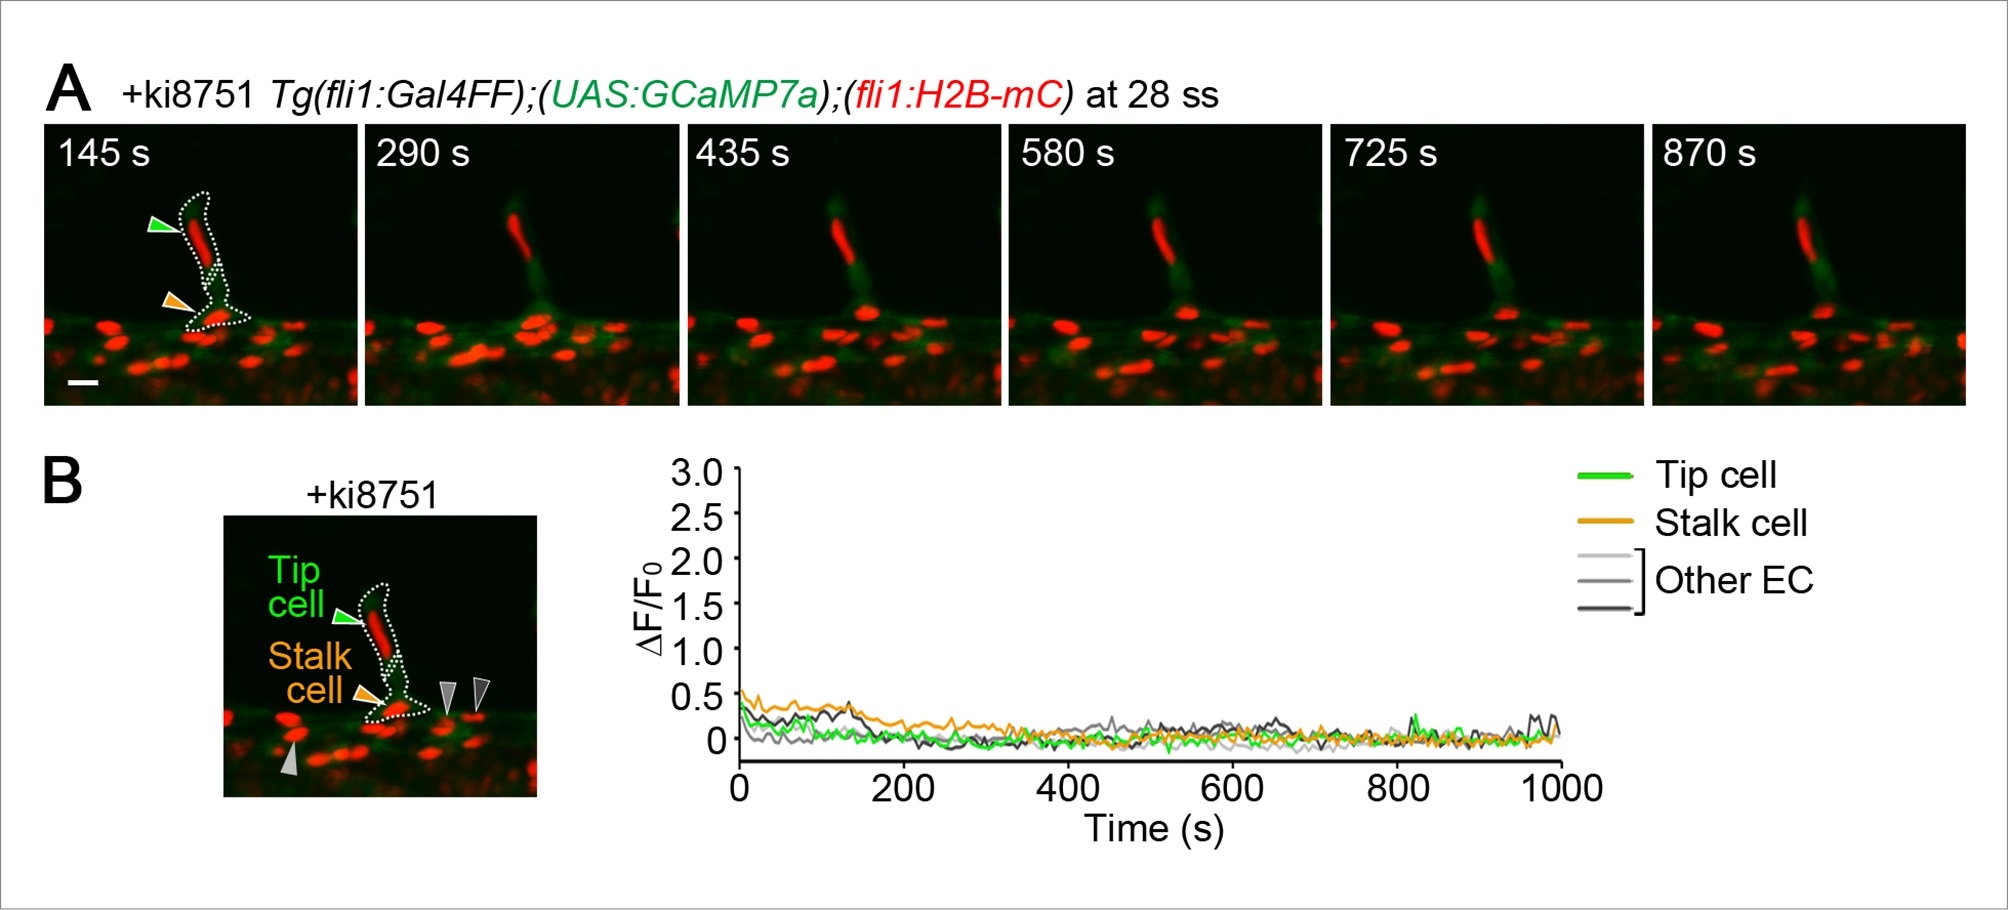
Ca2+ responses during stalk cell budding from the DA are dependent upon Vegfr.
(A) 3D-rendered time-sequential images of Tg(fli1:Gal4FF);(UAS:GCaMP7a);(fli1:H2B-mC) embryos treated with ki8751 during stalk cell budding from the DA as in Figure 5A. The embryos were treated from 27 ss with ki8751 and time-lapse imaged at 28 ss. Green and orange arrowheads indicate tip and stalk cells, respectively. (B) The fluorescence changes in GCaMP7a (ΔF/F0) of individual ECs from A indicated by arrowheads (green, orange, light gray, dark gray, and black) at the left panel are shown as a graph.
Acknowledgments
This image is the copyrighted work of the attributed author or publisher, and
ZFIN has permission only to display this image to its users.
Additional permissions should be obtained from the applicable author or publisher of the image.
Full text @ Elife