
|
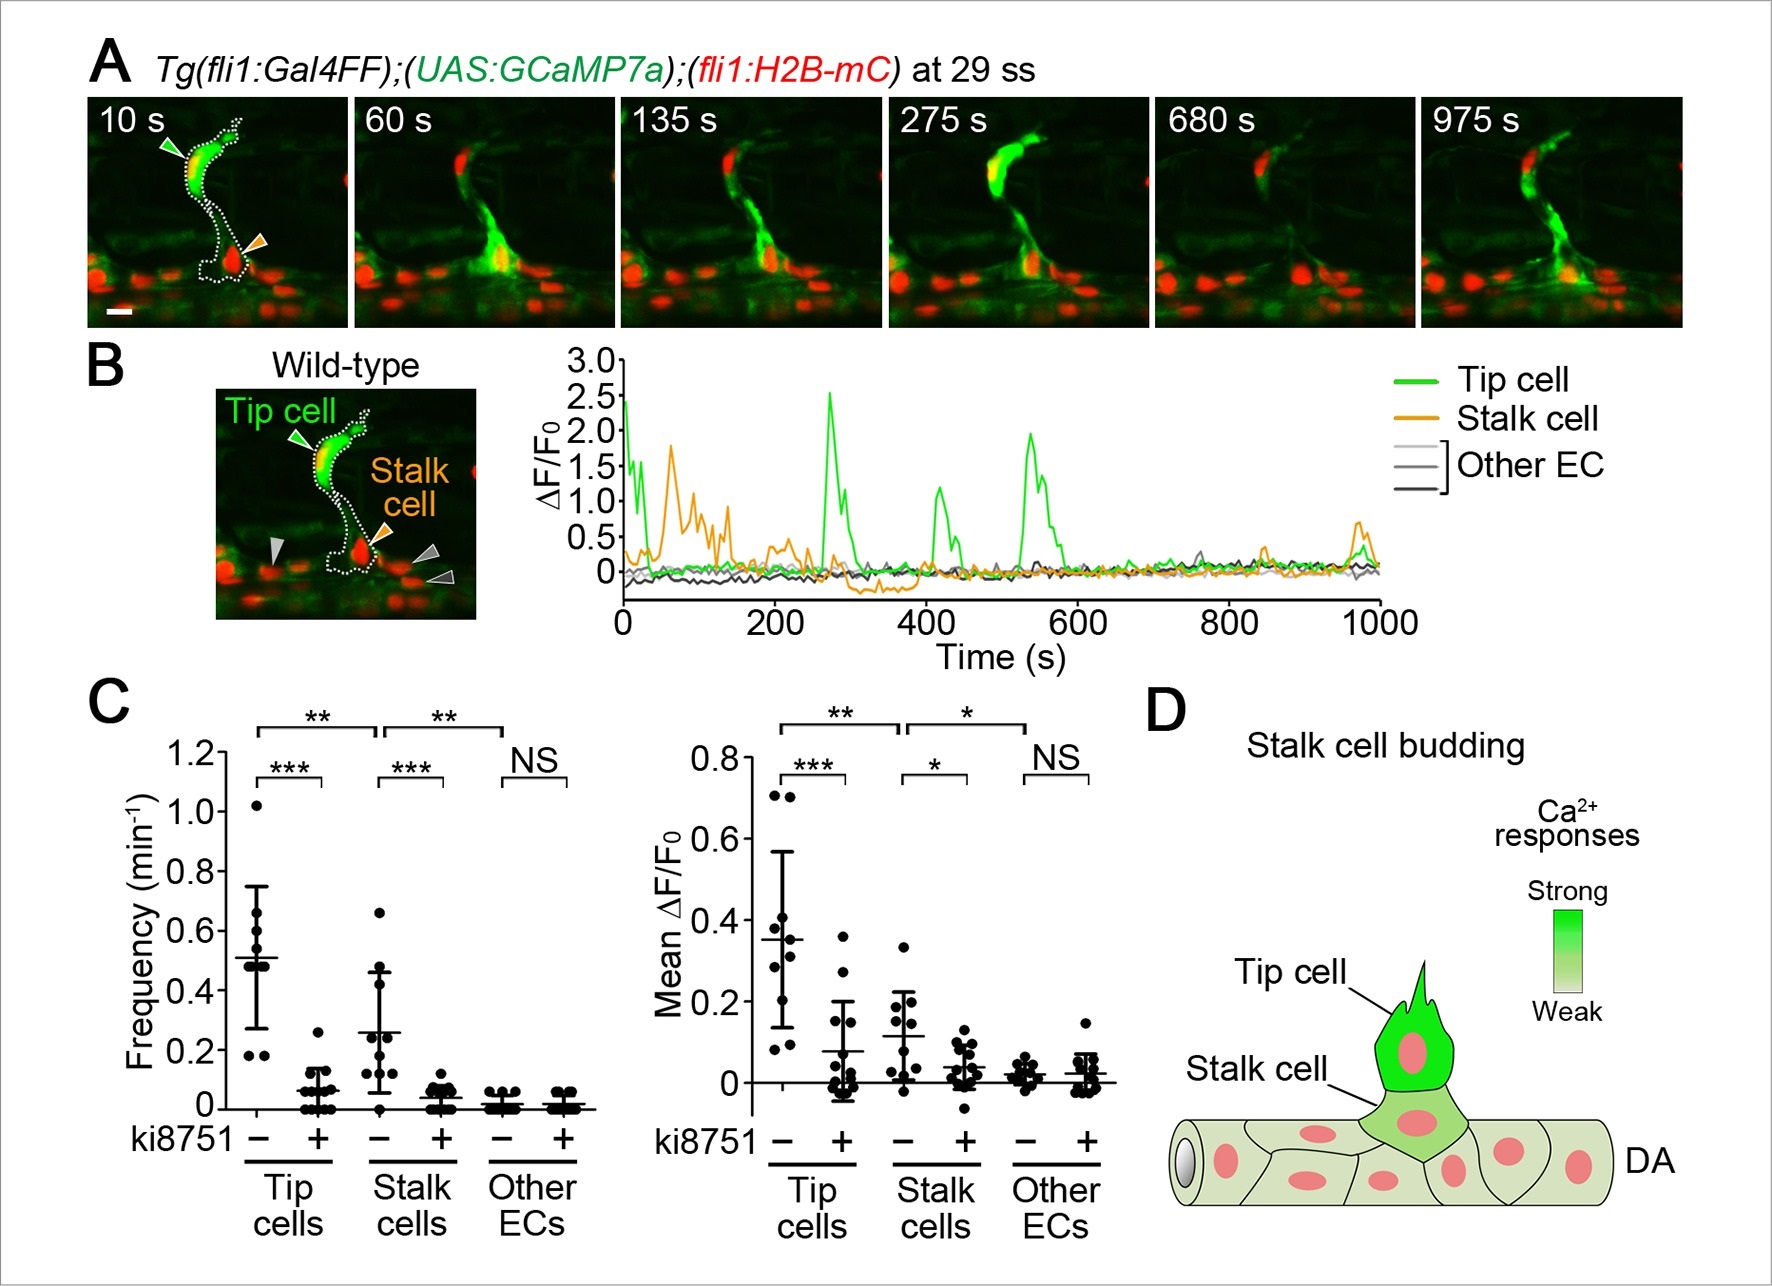
Fig. 5
Ca2+ oscillations in stalk cells during budding from the DA.
(A) 3D-rendered time-sequential images of Tg(fli1:Gal4FF);(UAS:GCaMP7a);(fli1:H2B-mC) embryos during stalk cell budding from the DA (29 ss). Green and orange arrowheads indicate tip and stalk cells, respectively. (B) The fluorescence changes in GCaMP7a (ΔF/F0) of individual ECs from A indicated by arrowheads (green, orange, light gray, dark gray, and black) at the left panel are shown as a graph. (C) Quantification of Ca2+ oscillatory activity in untreated and ki8751-treated embryos during stalk cell budding from the DA as in A and Figure 5—figure supplement 1A, respectively. Graphs show Ca2+ oscillation frequency (left) and mean ΔF/F0 (right) in tip cells, stalk cells and other ECs within the DA in untreated and ki8751-treated embryos (Untreated, n e 10; ki8751-treated, n e 13). (D) Stalk cells that are budding from the DA have significant Vegfr2 activity, albeit weaker than that in tip cells. Scale bar, 10 µm in A. *p < 0.05, **p < 0.01, ***p < 0.001; NS, not significant. DA, dorsal aorta.