
|
Fig. 2 S3
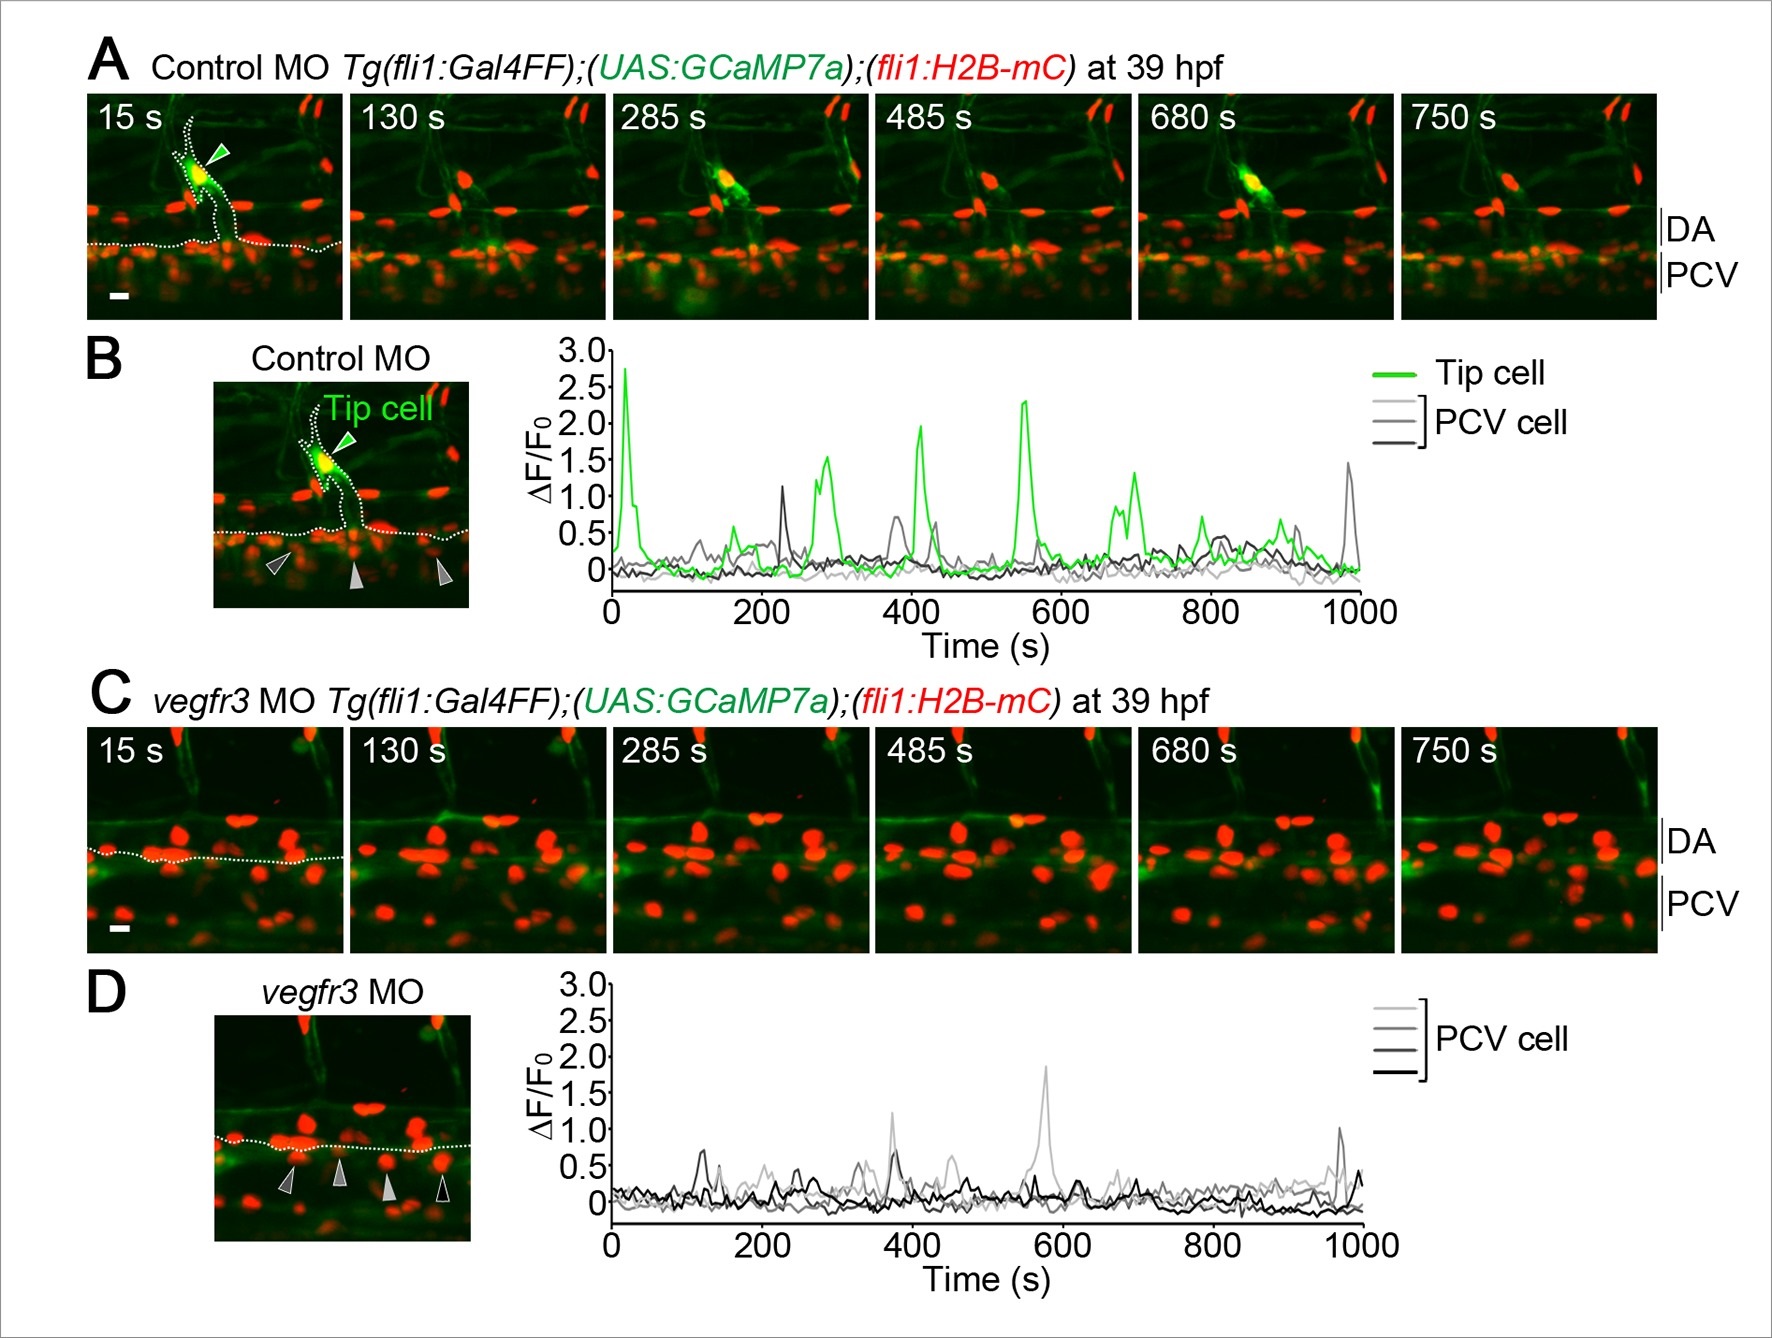
Ca2+ oscillations in the venous sprouts from the posterior cardinal vein (PCV).
(A) 3D-rendered time-sequential images of Tg(fli1:Gal4FF);(UAS:GCaMP7a);(fli1:H2B-mC) embryos during vessel sprouting from the PCV injected with control MO (39 hpf). A green arrowhead indicates a tip cell of a venous sprout. A dashed line outlines the PCV and the venous sprout. (B) The fluorescence changes in GCaMP7a (ΔF/F0) of individual ECs from A indicated by arrowheads (green, orange, light gray, dark gray, and black) at the left panel are shown as a graph. (C) 3D-rendered time-sequential images of Tg(fli1:Gal4FF);(UAS:GCaMP7a);(fli1:H2B-mC) embryos injected with vegfr3 MO (39 hpf). (D) The fluorescence changes in GCaMP7a (ΔF/F0) of individual ECs from C indicated by arrowheads at the left panel are shown as a graph. Scale bars, 10 µm in A and C. DA, dorsal aorta; PCV, posterior cardinal vein.