
|
Fig. 2 S2
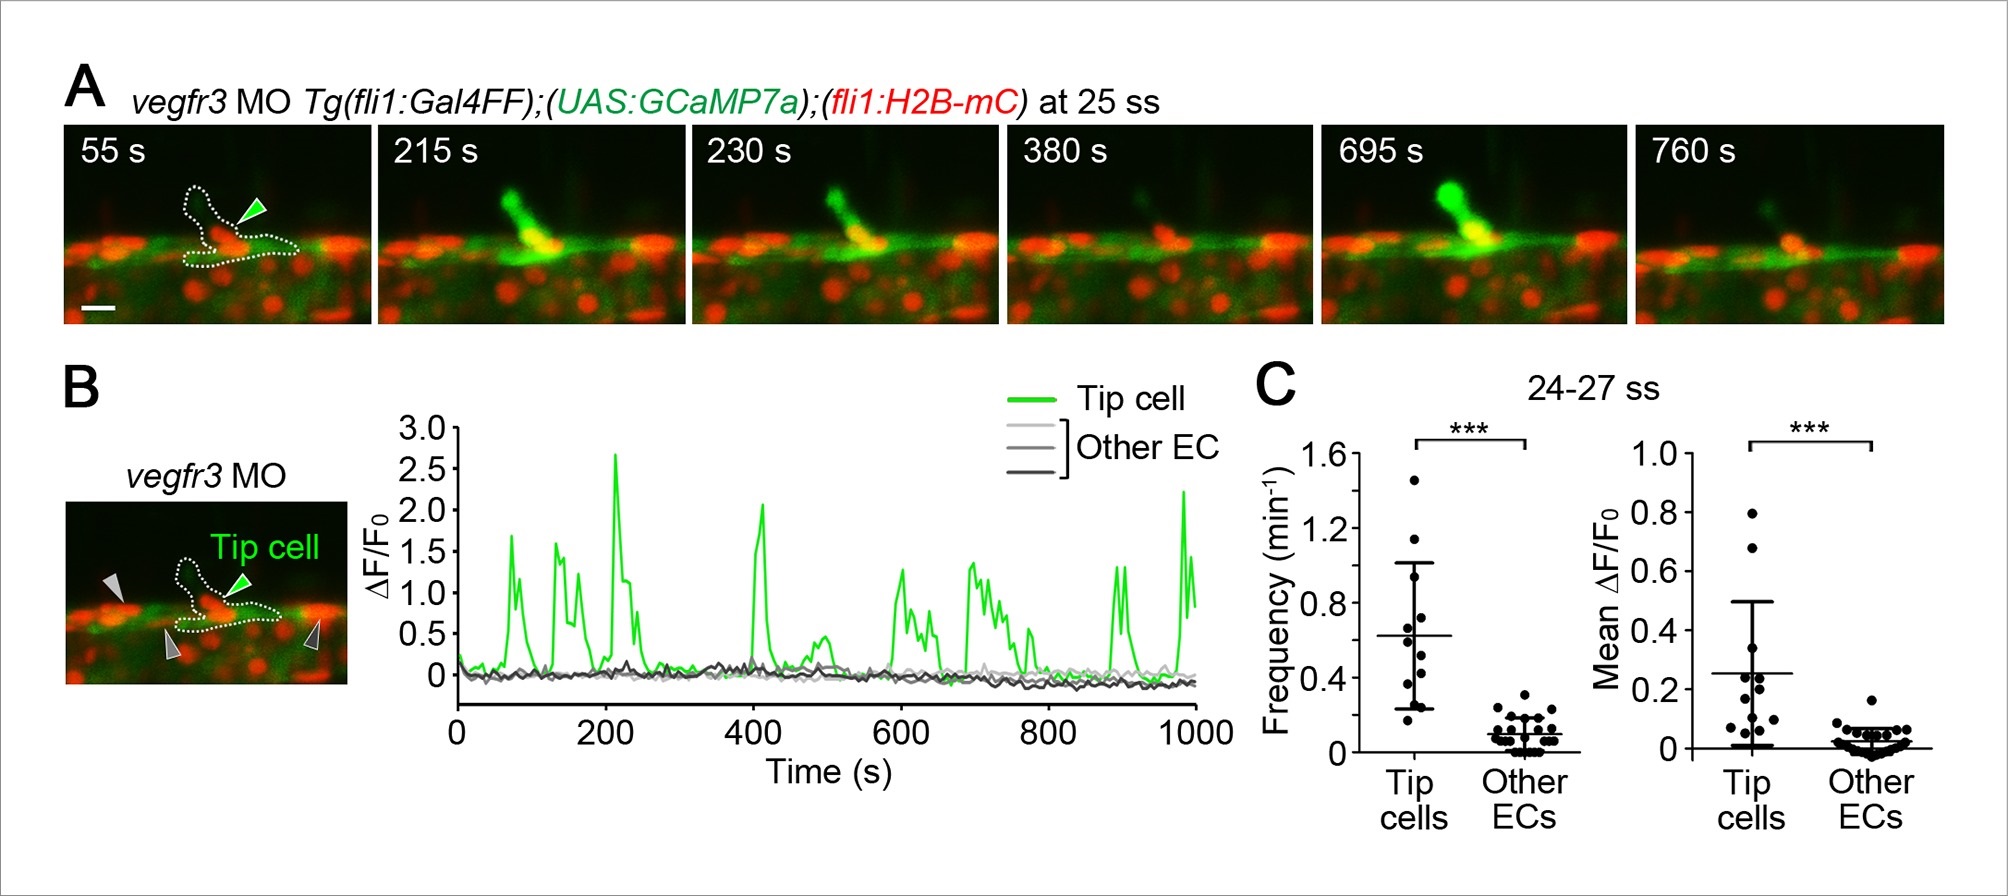
Vegfr3 is not involved in Ca2+ oscillations in tip cells budding from the dorsal aorta (DA).
(A) 3D-rendered time-sequential images of Tg(fli1:Gal4FF);(UAS:GCaMP7a);(fli1:H2B-mC) embryos injected with vegfr3 MO at 25 ss. A green arrowhead indicates a budding tip cell. (B) The fluorescence changes in GCaMP7a (ΔF/F0) of individual ECs from A indicated by arrowheads at the left panel are shown as a graph. (C) Quantification of Ca2+ oscillatory activity of vegfr3 morphants at 24–27 ss. Graphs show Ca2+ oscillation frequency (left) and mean ΔF/F0 (right) of tip cells and other ECs within the DA during tip cell budding (n ≥ 12). Scale bar, 10 µm in A. **p < 0.01, ***p < 0.001; NS, not significant.