
Fig. 10
- ID
- ZDB-IMAGE-160217-13
- Genes
- Publication
- Yokota et al., 2015 - Endothelial Ca(2+) oscillations reflect VEGFR signaling-regulated angiogenic capacity in vivo
- All Figures
- Figures for Yokota et al., 2015
|
Fig. 10
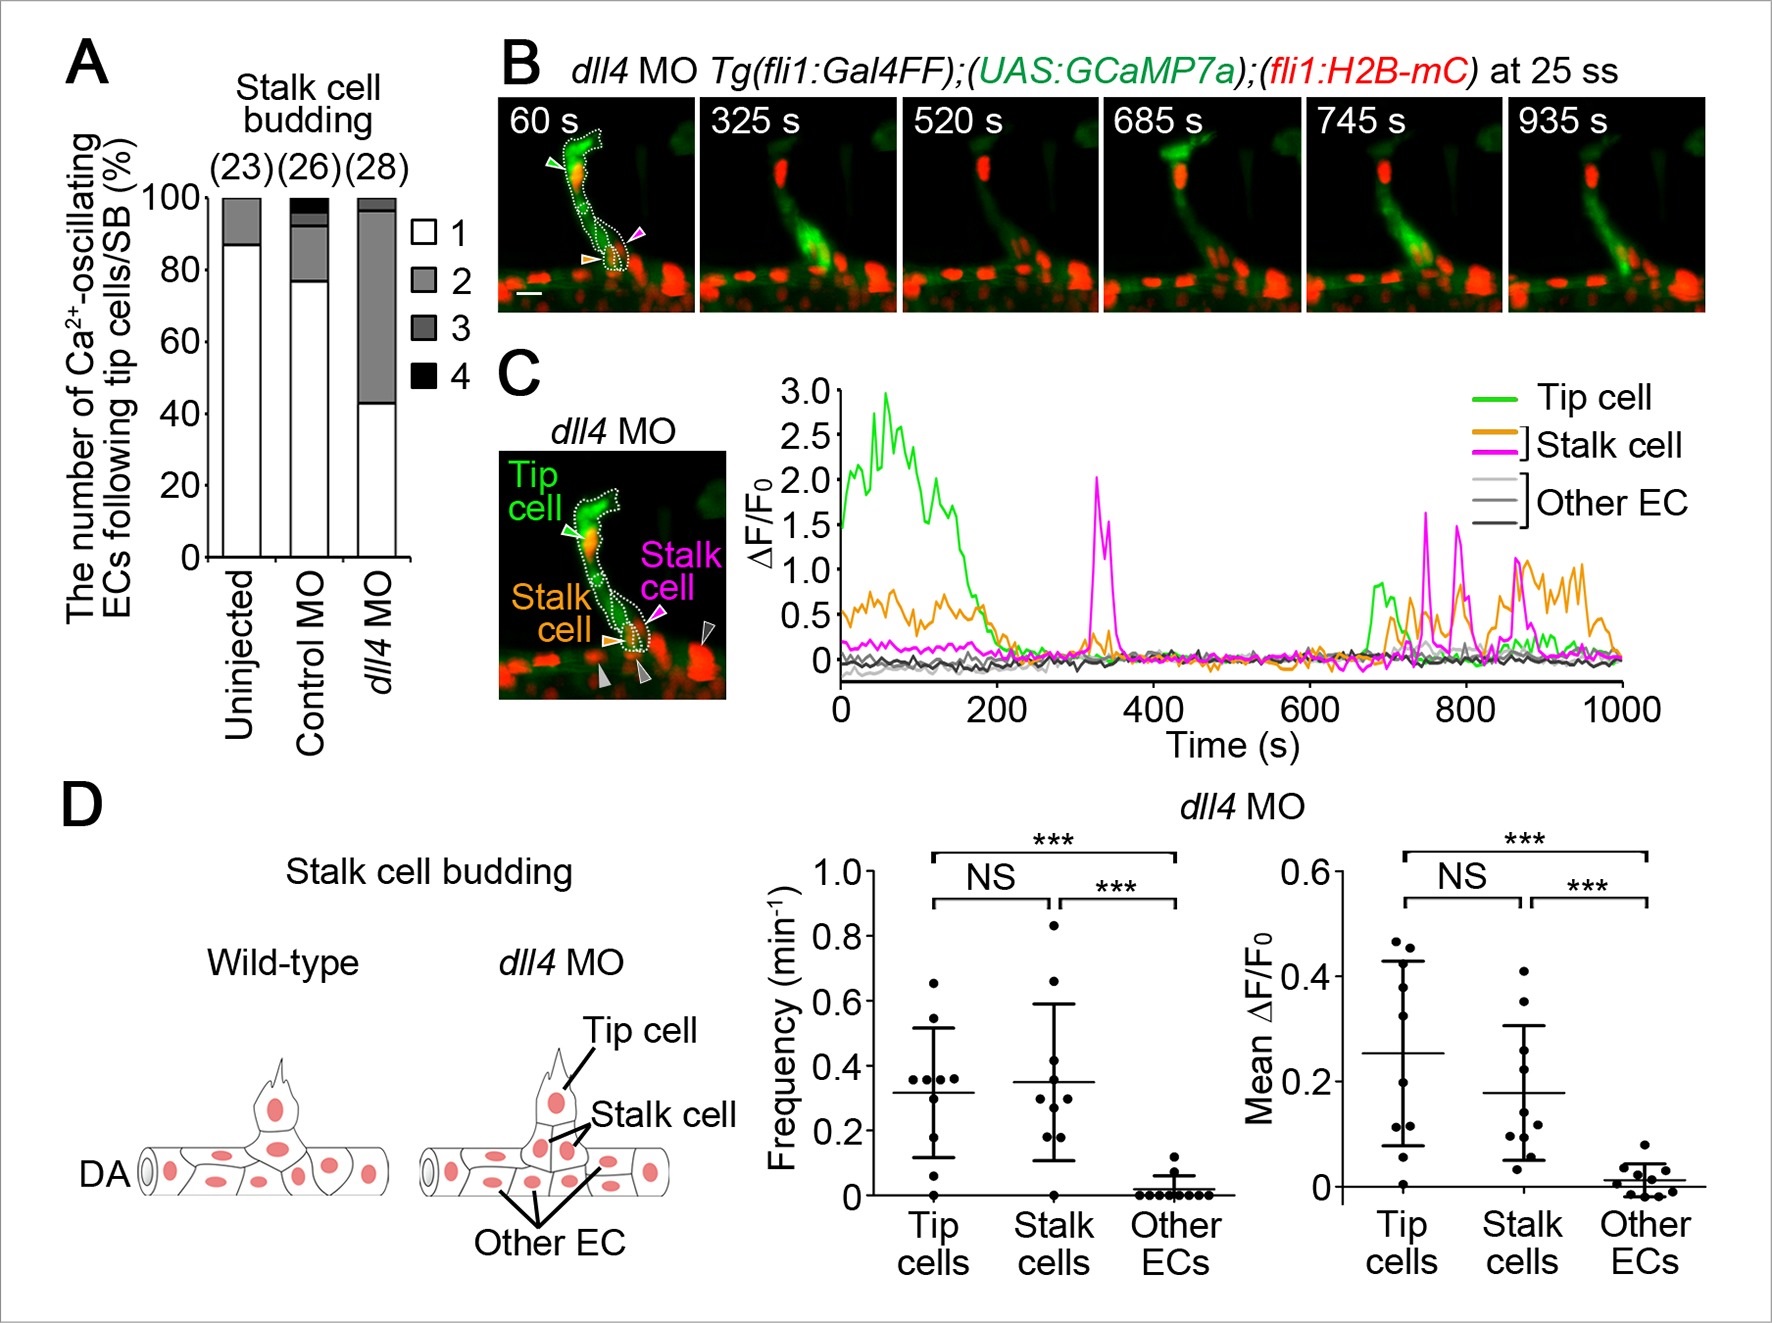
Dll4 is involved in the selection of single stalk cells.
(A) The number of Ca2+-oscillating ECs following tip cells in each ISV of uninjected, or control MO- or dll4 MO-injected Tg(fli1:Gal4FF);(UAS:GCaMP7a);(fli1:H2B-mC) embryos during stalk cell budding when an EC/ECs following a tip cell is/are budding from the DA. Graph shows the occurrence rate of the indicated numbers of Ca2+-oscillating cells in each ISV among the total number of ISVs observed (indicated at the top). (B) 3D-rendered time-sequential images of Tg(fli1:Gal4FF);(UAS:GCaMP7a);(fli1:H2B-mC) embryos during stalk cell budding from the DA injected with dll4 MO (25 ss). A green arrowhead indicates tip cell. Orange and red arrowheads indicate budding stalk cells following tip cell. (C) The fluorescence changes in GCaMP7a (ΔF/F0) of individual ECs from B indicated by arrowheads at the left panel are shown as a graph. (D) Ca2+ oscillation frequency (left) and mean ΔF/F0 (right) in tip cells, stalk cells, and other ECs within the DA in dll4 morphants during stalk cell budding (n ≥ 10). As illustrated at the left panel, we designated budding ECs that follow tip cells as stalk cells. Scale bar, 10 mm in B. ***p < 0.001; NS, not significant. DA, dorsal aorta.