
|
Fig. 1 S2
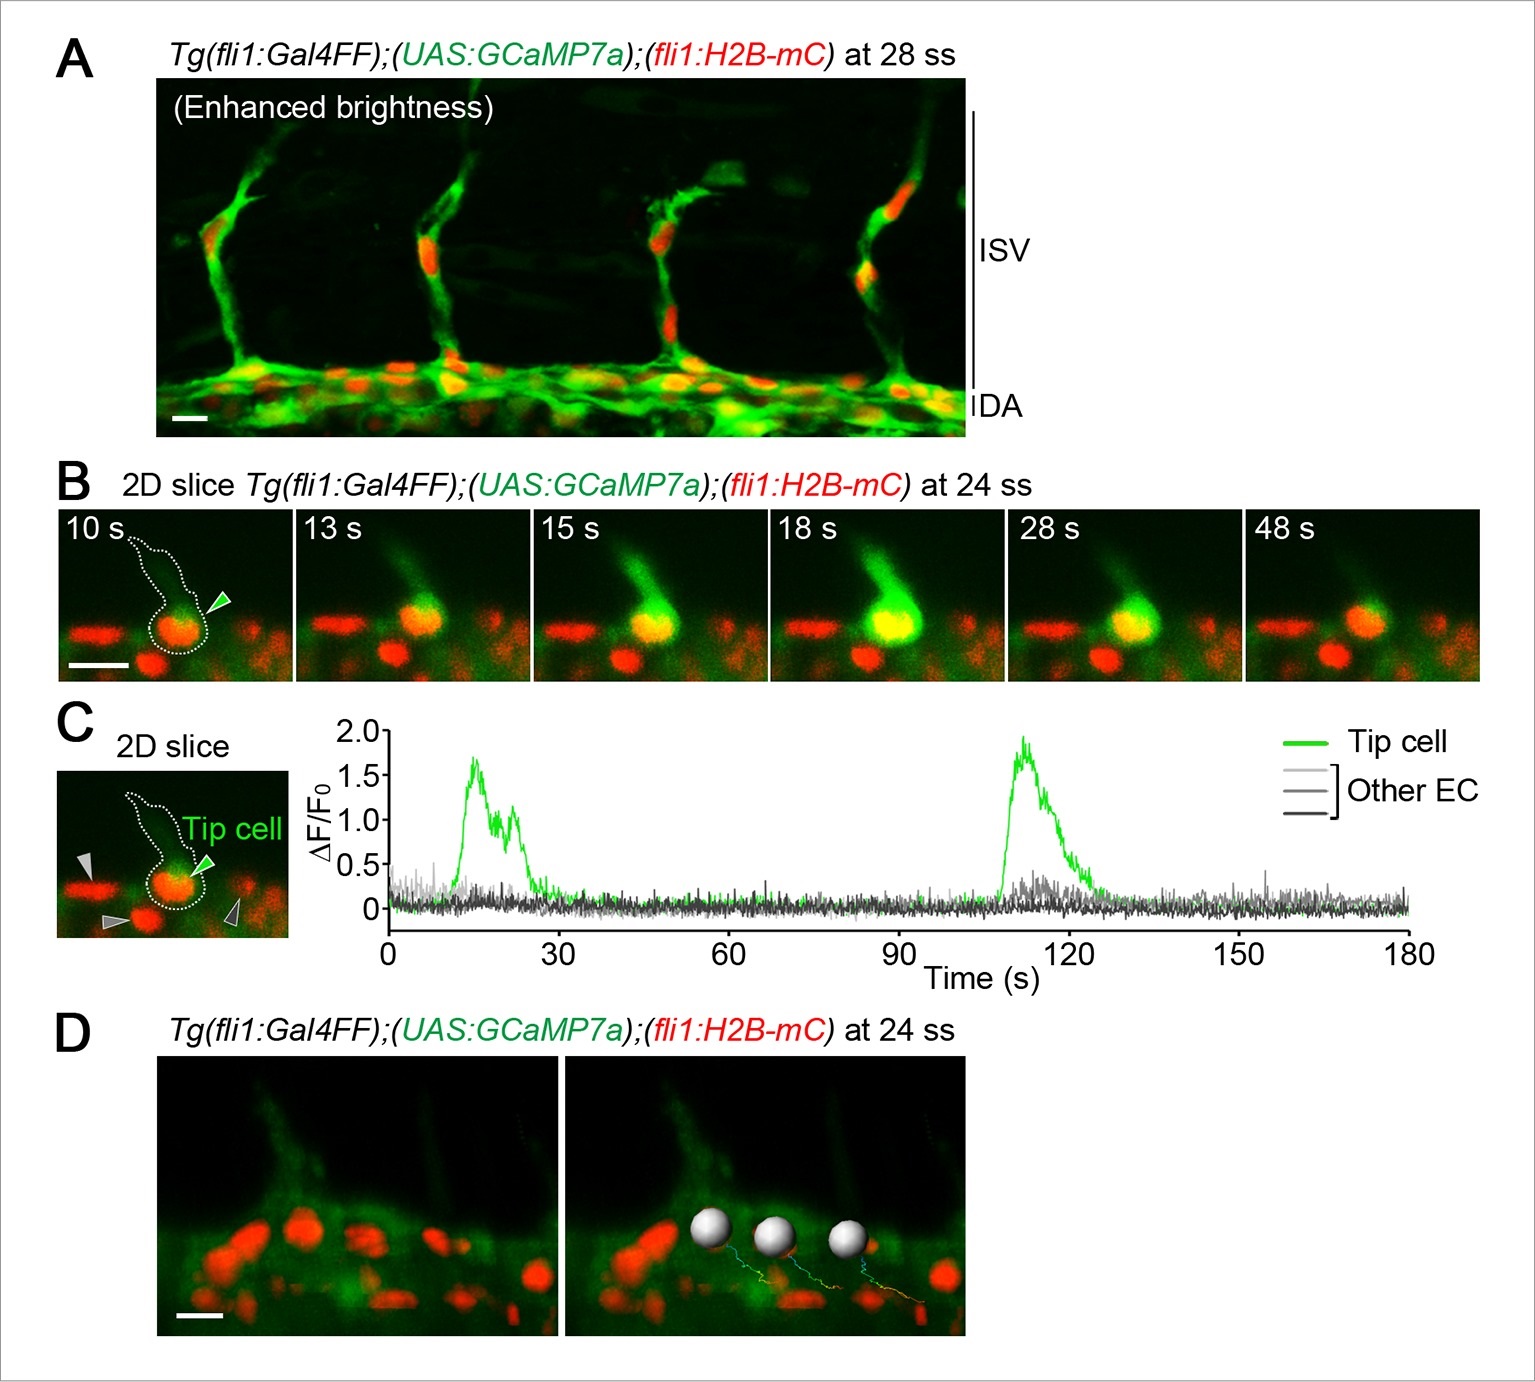
Quantitative analyses of intracellular Ca2+ dynamics in ECs.
(A) Confocal stack fluorescence images of Tg(fli1:Gal4FF);(UAS:GCaMP7a);(fli1:H2B-mC) embryos at 28 ss. The merged images of GCaMP7a (green) and H2B-mC (red) images are shown with enhanced brightness. Note that almost all ECs express GCaMP7a in developing trunk vessels. (B) Time-lapse 2D slice images of Tg(fli1:Gal4FF);(UAS:GCaMP7a);(fli1:H2B-mC) embryos taken every 100 ms at 24 ss using a light sheet microscope. A green arrowhead indicates a budding tip cell outlined by a dashed line. The elapsed time (s) after starting imaging of an embryo is indicated at the left upper corner. (C) The fluorescence changes in GCaMP7a (ΔF/F0) of individual ECs from B indicated by arrowheads (green, light gray, dark gray, and black) at the left panel are shown as a graph. (D) Quantification analyses for intracellular Ca2+ levels in individual EC. Time-lapse 3D images of Tg(fli1:Gal4FF);(UAS:GCaMP7a);(fli1:H2B-mC) embryos were analyzed for quantification using IMARIS software. The merged images of GCaMP7a (green) and H2B-mC (red) images are shown in the left panel. To quantify intracellular Ca2+ of individual EC at each time point, the cell nucleus was tracked over time. Trajectories of individual nuclei were shown in the right panel. To mark the individual EC which we analyze, we set a spherical region of interest (ROI) as shown in the right panel (see ‘Materials and methods’). We then defined the highest voxel intensity of the GCaMP7a fluorescence (green) within the ROI as the fluorescence intensity (F) in the EC. Scale bars, 10 µm in A, B, and D. ISV, intersomitic vessel; DA, dorsal aorta.