
|
Fig. 6
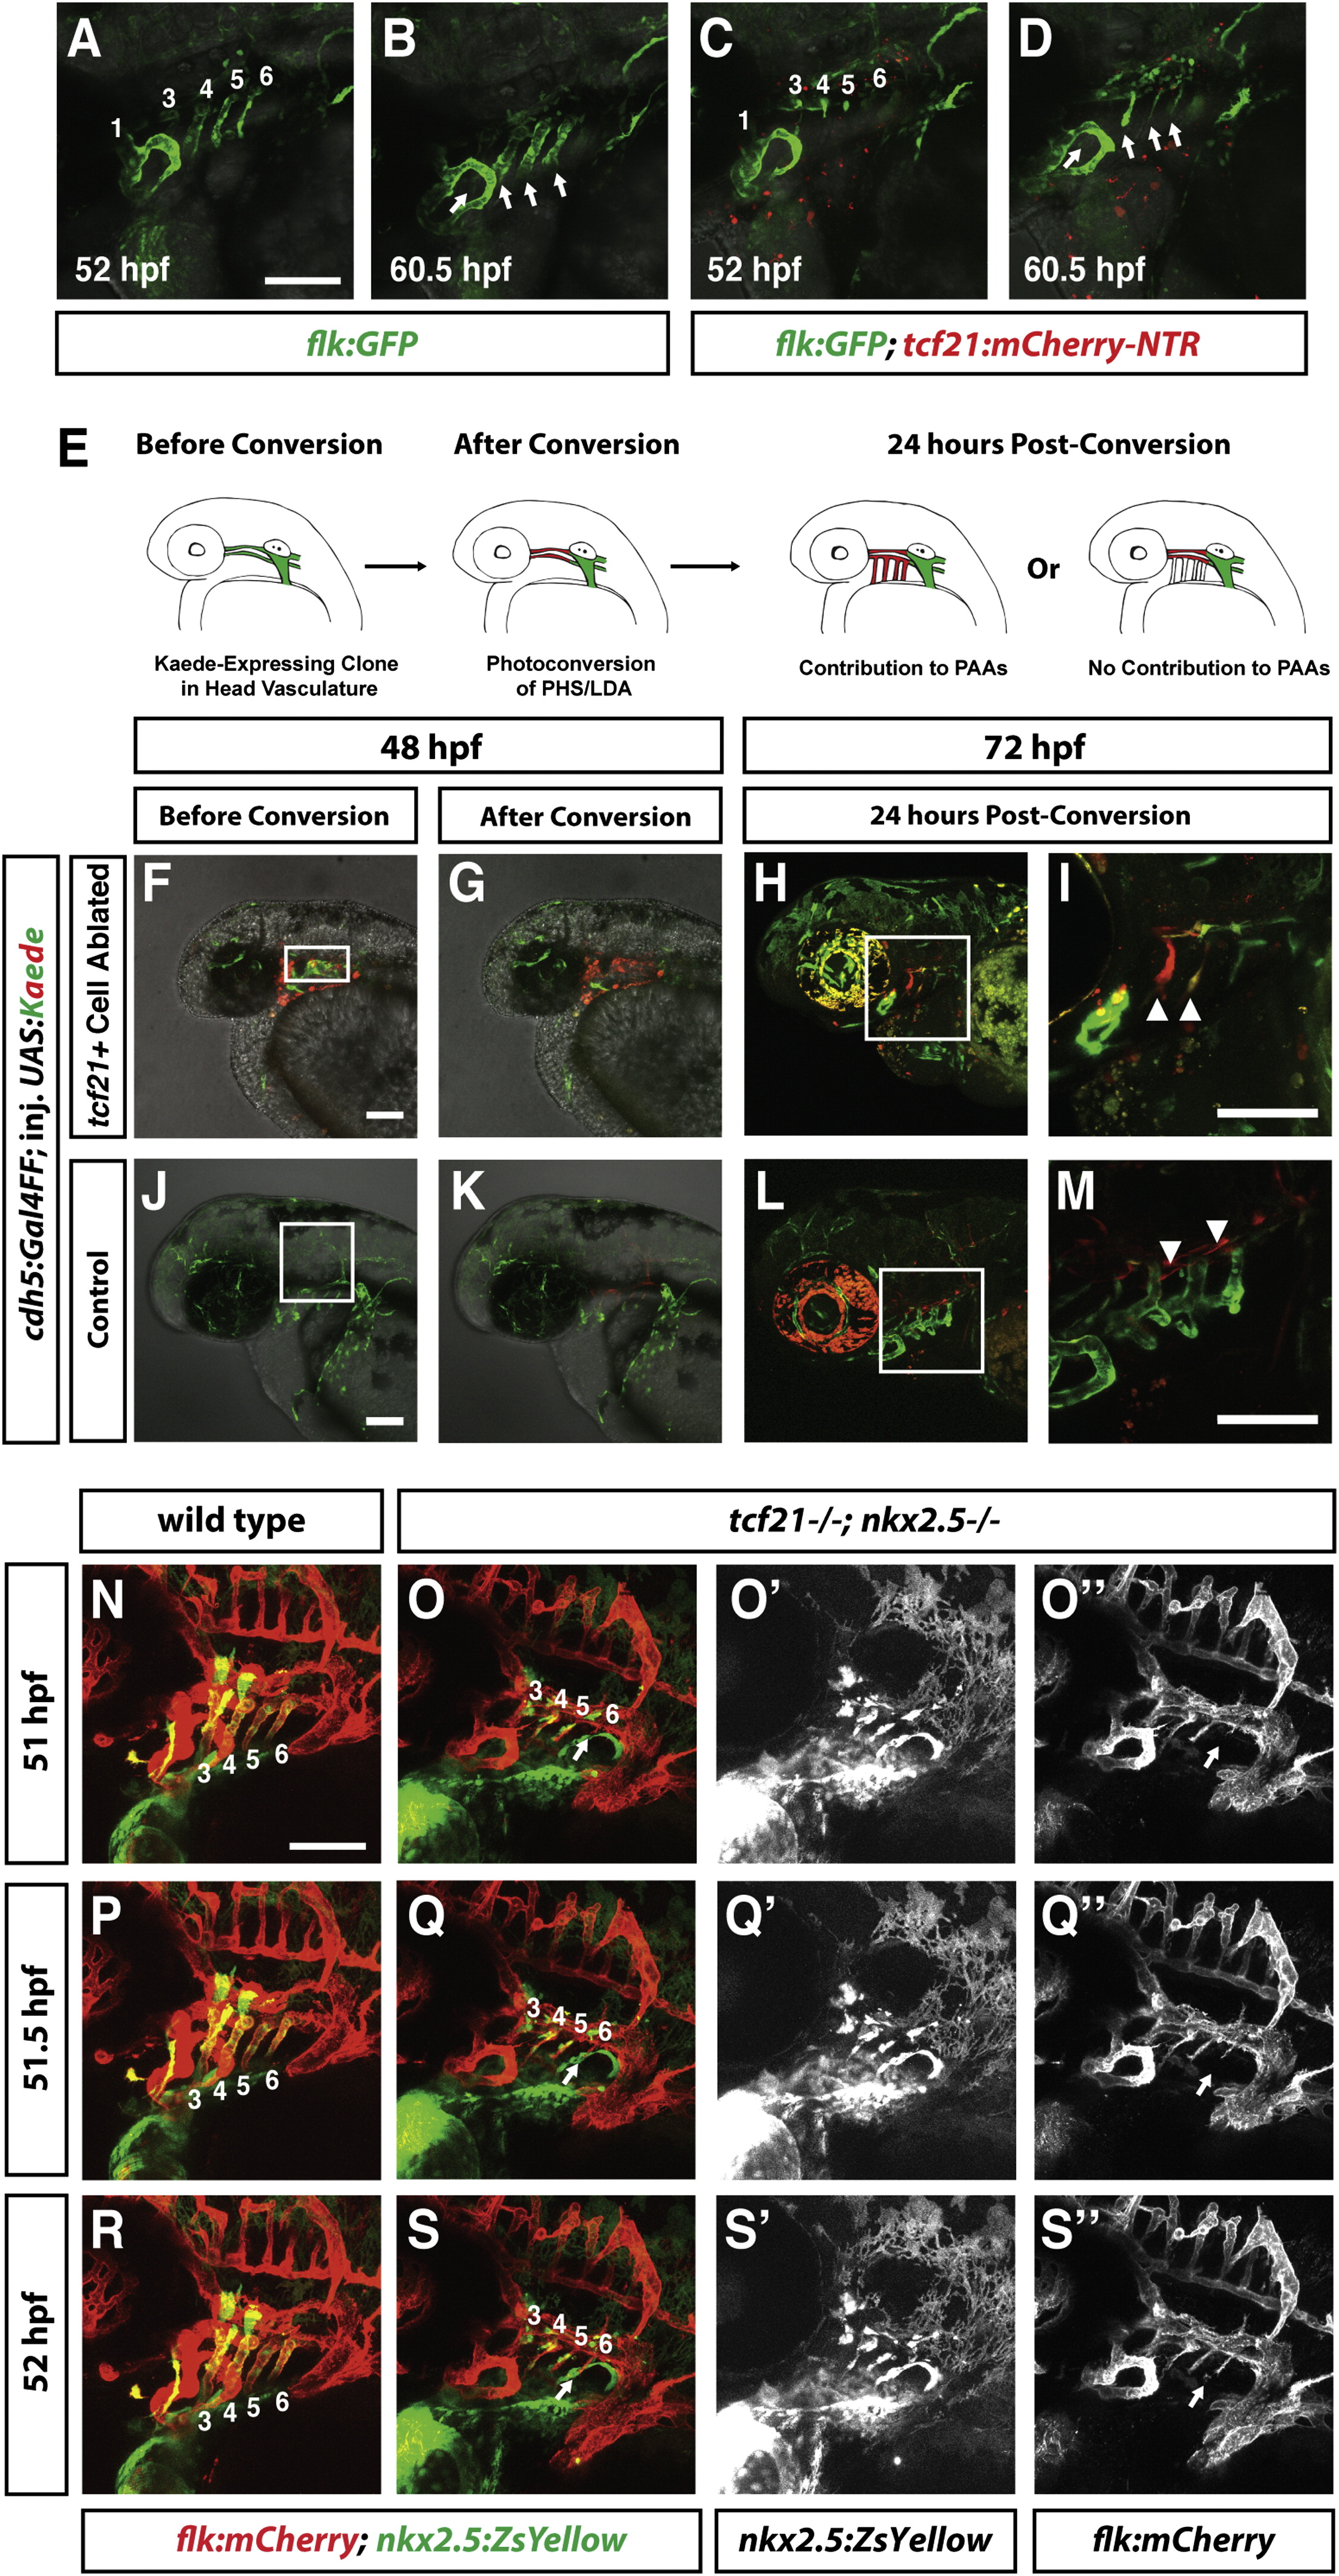
Endothelial Cells from the Dorsal Head Vasculature Compensate for Lost pPAAs in tcf21 Cell-Ablated Embryos and tcf21/ nkx2.5/ Embryos
(A–D) Live images of two embryos of indicated stages and genotypes carrying the indicated transgenes and treated with Mtz as described in Figure 3A. Numbers in (A) and (C) indicate the PAA, and arrows in (B) and (D) indicate the pPAAs. Images correspond to the first and last frames in Movie S4.
(E) Schematic of experimental design. cdh5:Gal4FF; tcf21:mCherry-NTR embryos were injected at the one-cell stage with UAS-Kaede DNA. The embryos were treated with Mtz to ablate the tcf21+ cells as shown in Figure 3A. Embryos with green Kaede expression in the dorsal head vasculature were imaged, Kaede was photoconverted from green to red, and the contribution of endothelial cells in the dorsal head vasculature to the pPAAs was assessed 24 hr later.
(F) Mtz-treated cdh5:Gal4FF; tcf21:mCherry-NTR embryo with mosaic green Kaede expression in the head vasculature. Dying tcf21+ cells are expressing mCherry protein.
(G) Same embryo as in (F), but Kaede-expressing endothelial cells in the dorsal head vasculature have been photoconverted from green to red. Region of photoconversion is marked by a rectangle in (F).
(H and I) Same embryo as in (F) 24 hr post-photoconversion. Photoconverted dorsal endothelial cells have migrated ventrally to compensate for the ablated pPAA progenitors and contribute to the pPAAs (arrowheads in I). Square in (H) indicates magnified region shown in (I) (n = 2).
(J) Mtz-treated cdh5:Gal4FF embryo not transgenic for tcf21:mCherry-NTR with mosaic green Kaede expression in the head vasculature (n = 8).
(K) Same embryo as in (J), but Kaede-expressing endothelial cells in the dorsal head vasculature have been photoconverted from green to red. Region of photoconversion is marked by a rectangle in (J).
(L and M) Same embryo as in (J) 24 hr post-photoconversion. Photoconverted, dorsal endothelial cells do not migrate ventrally and do not contribute to the pPAAs (arrowheads in M). Square in (L) indicates magnified region shown in (M).
Scale bars represent 100 µm. Anterior is to the left, and dorsal is up.
(N–S′′) Live images of two embryos of indicated stages and genotypes carrying the indicated transgenes. Numbers in (N)–(S) indicate the PAA, and arrows in (O), (O′′), (Q), (Q′′), (S), and (S′′) indicate endothelial cells that are migrating into arch 6 to form PAA 6. (O′), (Q′), and (S′) show the green channel only (nkx2.5:ZsYellow), and (O′′), (Q′′), and (S′′) show the red channel only (flk:mCherry). Images correspond to time points 51, 51.5, and 52 hpf (frames 11, 12, and 13) in Movie S6. Lateral views. Anterior is to the left. Scale bars represent 100 µm.