
Fig. 2
- ID
- ZDB-IMAGE-160215-2
- Genes
- Antibodies
- Publication
- Nagelberg et al., 2015 - Origin, specification and plasticity of the great vessels of the heart.
- All Figures
- Figures for Nagelberg et al., 2015
|
Fig. 2
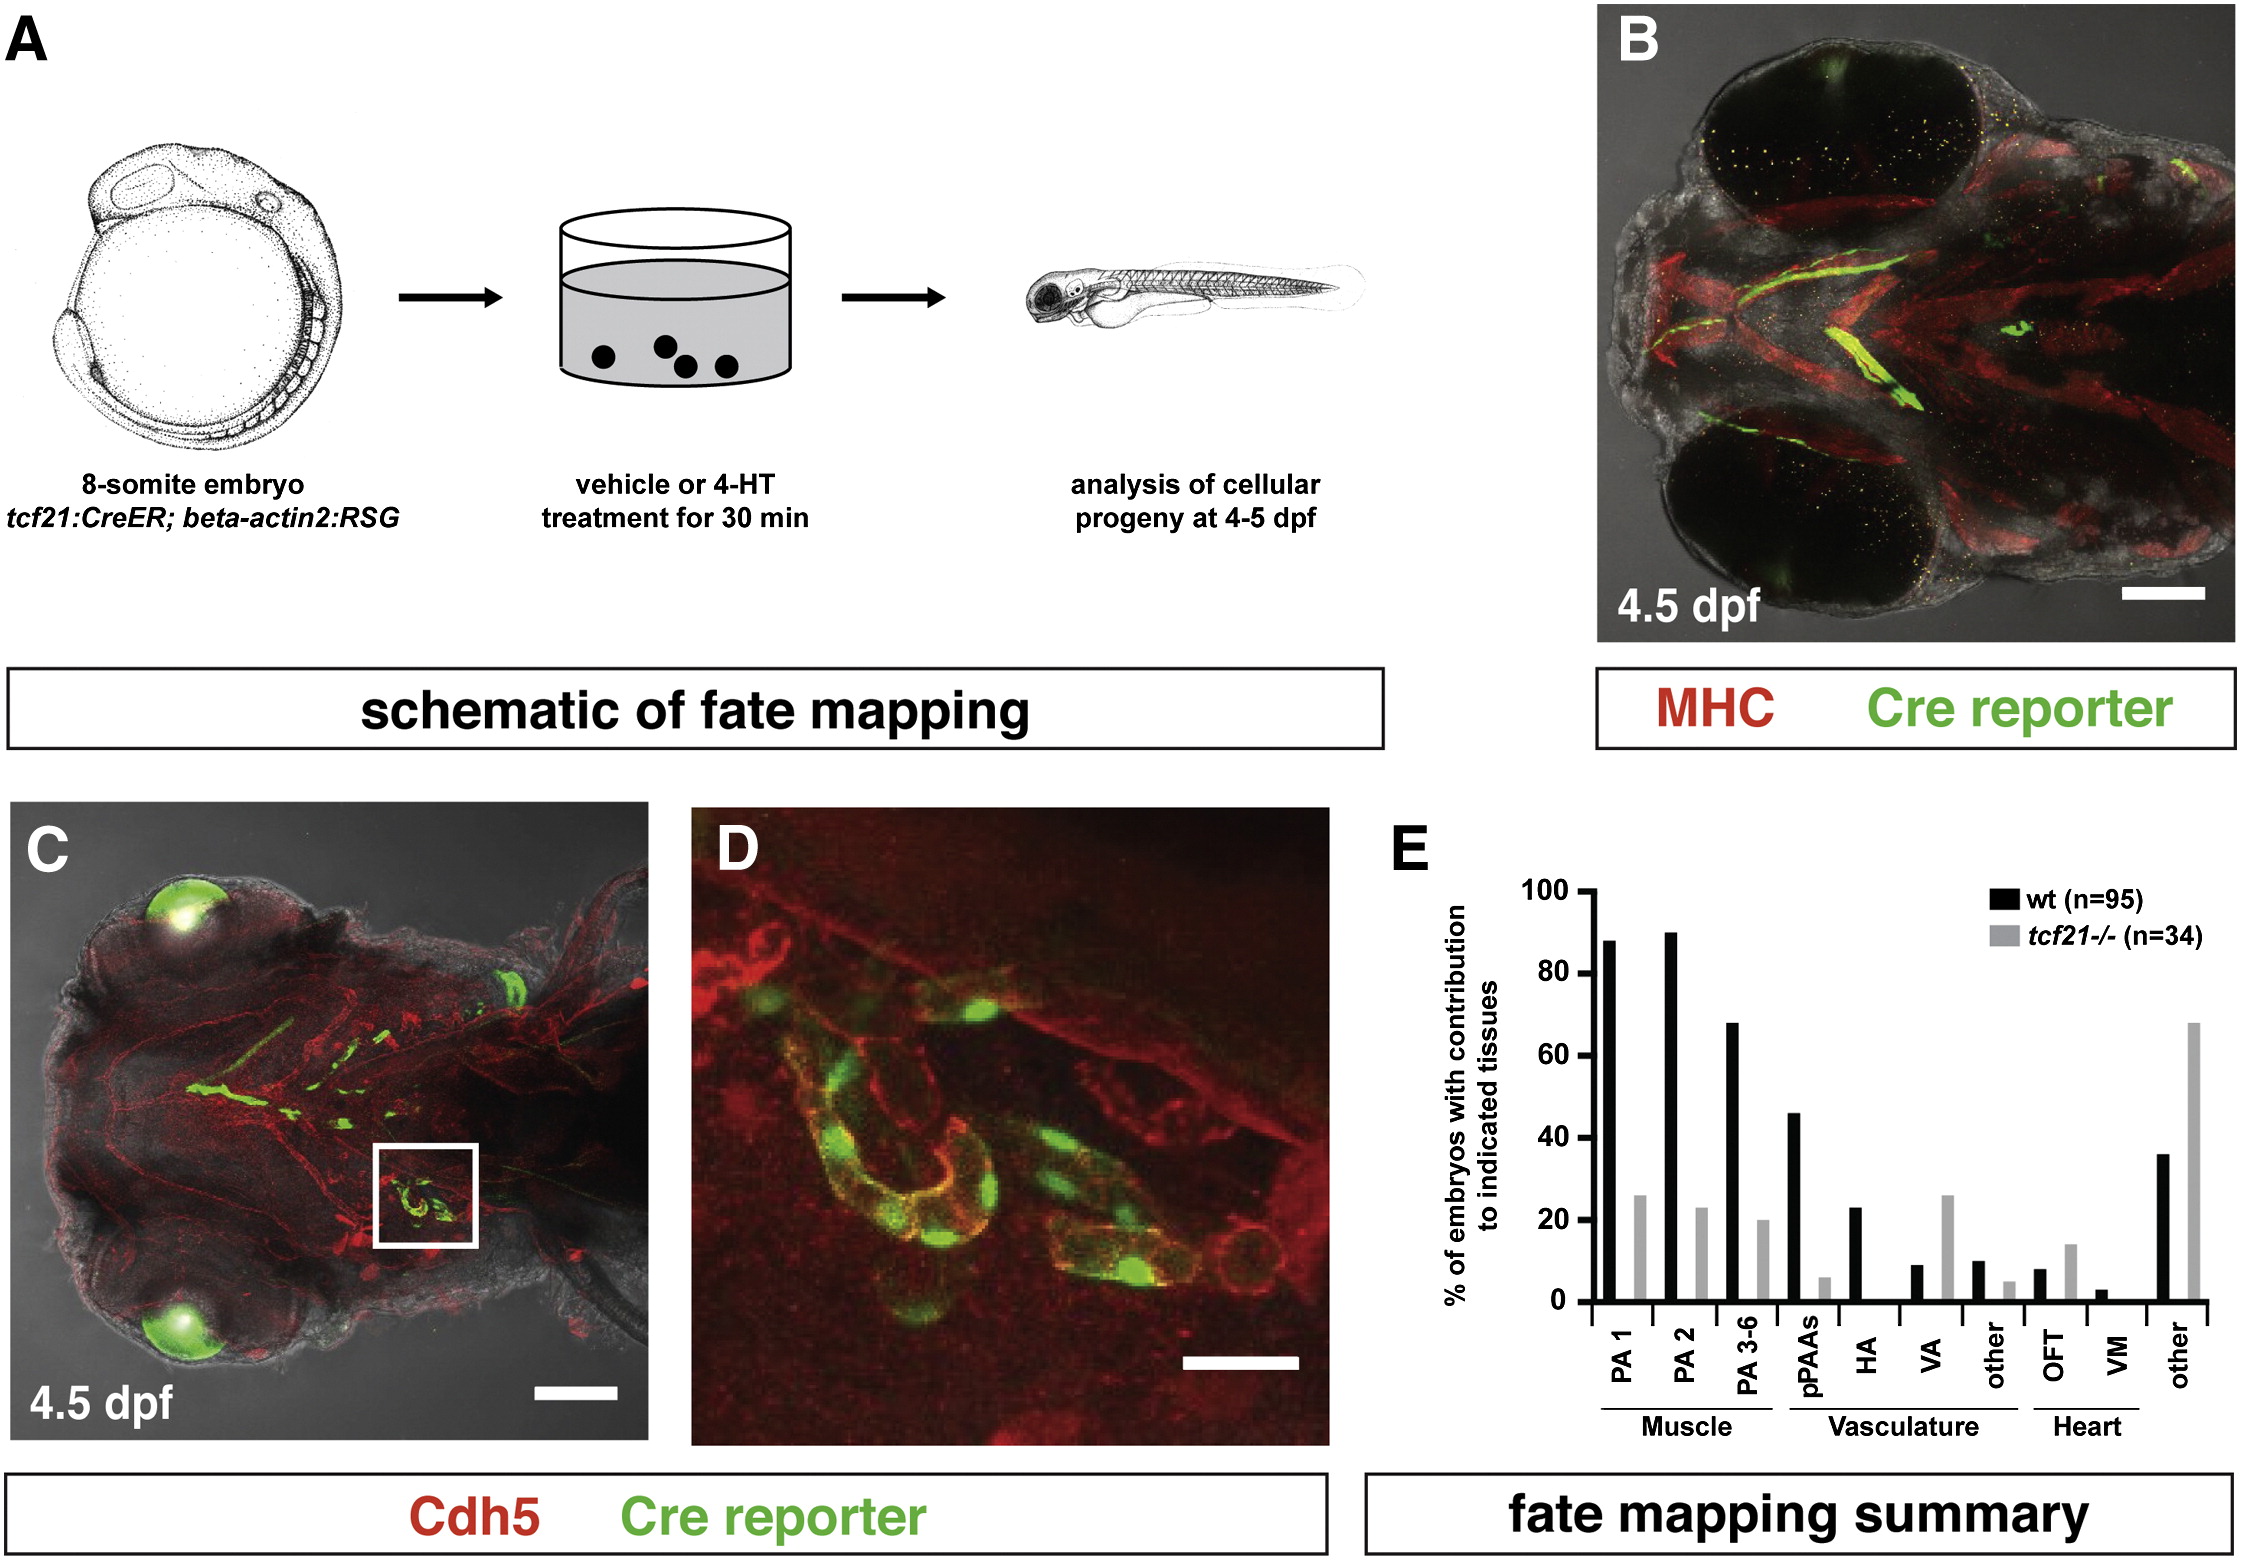
tcf21+ Cells Contribute to the Head Muscles, the Head Vasculature, and the Outflow Tract of the Heart
(A) Schematic representation of fate-mapping experiment. Images modified from [29].
(B) Image of tcf21:CreER; bactin2:RSG embryo stained for Myosin Heavy Chain and GFP to mark the head muscles and the Cre reporter, respectively.
(C and D) Image of tcf21:CreER; bactin2:RSG embryo stained for Cdh5 and GFP to mark the vasculature and the Cre reporter, respectively. Square in (C) indicates magnified region in (D) (n = 8).
(E) Summary of tcf21+ cell contributions to different tissues in wild-type embryos and in tcf21 mutant embryos assessed by live confocal microscopy (wt embryos, n = 95; tcf21/ embryos n = 34).
Scale bars represent 100 µm (B and C) and 10μm (D). Anterior is to the left. Ventral views. From left to right: PA1, pharyngeal arch 1-derived skeletal muscle; PA2, pharyngeal arch 2-derived skeletal muscle; PA 3–6, skeletal muscle derived from PAs 3–6; pPAAs, pharyngeal arch arteries 3–6; HA, hypobranchial artery; VA, ventral aorta; other, other vascular labeling; OFT, outflow tract (myocardium, endothelium, smooth muscle, or epicardium); VM, ventricle (myocardium, endothelium, smooth muscle, or epicardium); other, cells derived from tcf21-expressing progenitors that we cannot unambiguously assign to a specific tissue.