
|
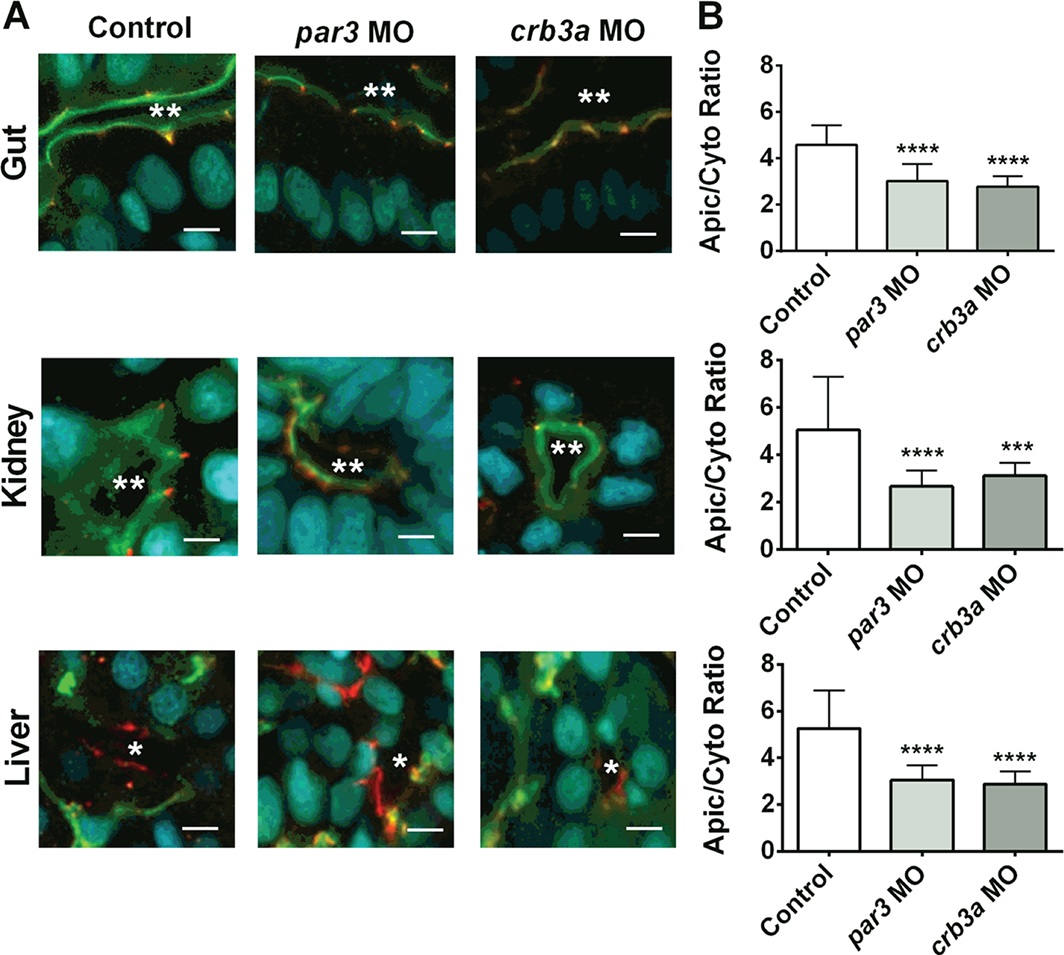
Fig. 6
Localization of aPKC in epithelial cells in the gut, kidney and liver in morpholino-treated zebrafish larvae. At 1–4 cell stage, embryos were left untreated (Control, white bars) or injected with morpholinos against Par3 (Par3 MO, light grey bars) and Crb3a (Crb3a MO, dark grey bars) and were immuno-stained for aPKC (green) and ZO-1 (red) and nuclei were stained with DAPI (blue). From confocal images shown in A, the apical/basolateral ratio for aPKC was determined (B). In (A), scale bar = 5 µm; ** represent lumen in gut and kidney, * represent liver sinusoids. In (B), data are mean and standard of 100 measurements obtained from 10 larvae. ***p < 0.001; ****p < 0.0001 relative to Control (one-way ANOVA with Bonferroni post-test).