
|
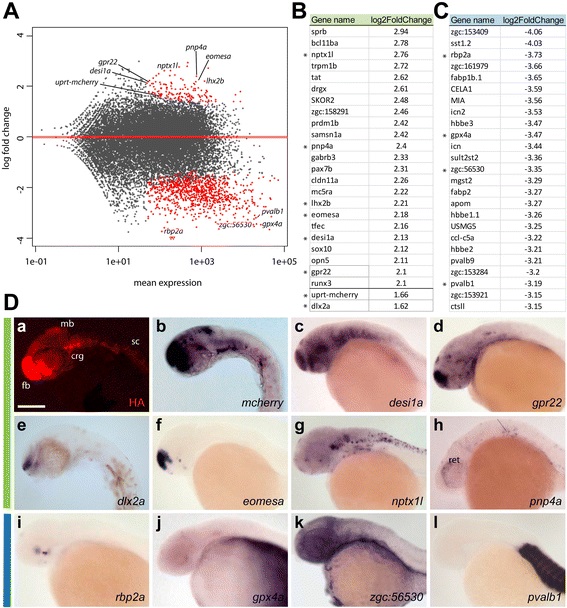
Fig. 4
Data analysis and expression patterns of 4tU-labeled mRNA transcripts isolated from whole embryos. a Distribution plot showing the log fold change of individual reads compared to the mean expression using DESeq2. The red dots indicate significantly enriched or depleted genes. b List of the top enriched (green) and (c) depleted (blue) genes and their log2-fold change compared to total mRNA expression levels. Genes used for expression study are marked with asterisks. In addition uprt-mcherry and dlx2a are shown to demonstrate enrichment for the transgene and a gene common with adult purified mRNA, respectively. d In situ hybridization of 24–26 hpf embryos, lateral view showing enriched (b-h, green bar) or depleted genes (i-l, blue bar). dc,d,f-l show images published by The Zebrafish Model Organism Database (ZFIN) [47,48]. fb, forebrain, mb, midbrain, crg, cranial ganglia, sc, spinal cord. Scale bar represents 100 µm