
|
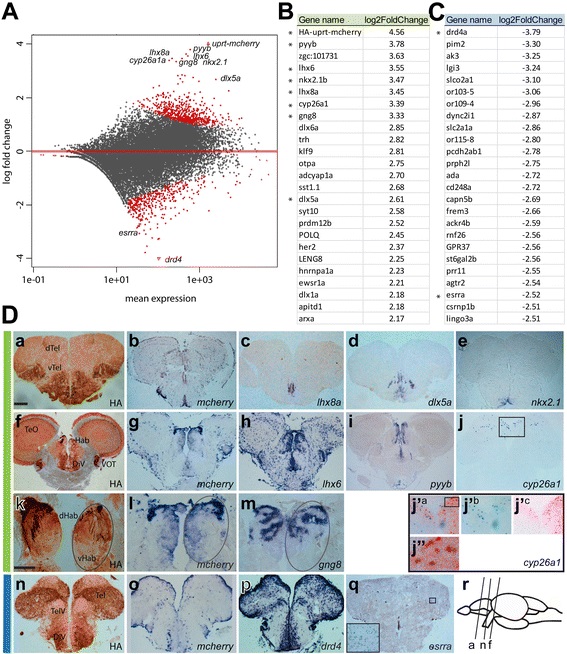
Fig. 2
Data analysis and verification of 4tU-labeled mRNA isolated from adult zebrafish brain. a Distribution plot showing the log fold change of individual reads compared to the mean expression using DESeq2. The red dots indicate significantly enriched or depleted genes (padj < 0.1). Some labeled enriched or depleted genes were analyzed for their expression pattern (see d). b List of the most-enriched genes (green) and (c) most depleted genes (blue) and their log2-fold change compared to total mRNA expression levels. Asterisks mark genes used for expression studies. d Cross sections of transgenic adult zebrafish brains labeled with HA labeling (a, f, k, n) or in situ probes of enriched genes (b-e, g-j, l, m green bar) as indicated on each image. j′a-c and j′′ are higher magnifications of boxes shown in j and j′, respectively. j′b and j′c show cyp26a1 in situ hybridization and HA IHC labeling, respectively. j′a and j′′ show cyp26a1 in situ hybridization and HA IHC labeling. Expression of depleted genes (p,q, blue bar). Cartoon (in r) showing the corresponding sections in a, f and n. dTel, dorsal Telencephalon, vTel, ventral Telencephalon, Hab, habenula, dHab, dorsal Hab, vHab, ventral Hab, TeO, optic tectum, DiV, diencephalic ventricle, VOT, ventrolateral optic tract, TelV, telencephalic ventricle. Scale bars represent 100 µm in da-j, n,q and 65 µm in dk-m