
|
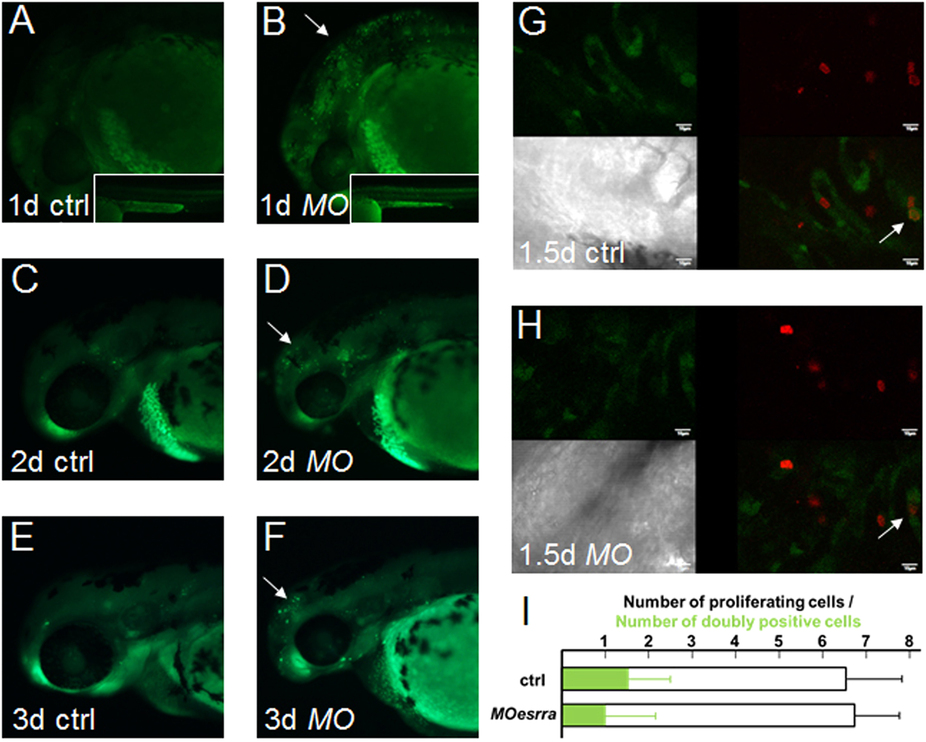
Fig. 5
ESRRa regulates survival but not proliferation of cartilaginous cells.
(A–F) 1-cell stage of embryos were injected with either MOctrl or MOesrra, raised and subjected to acridine orange stain to determine apoptotic cells at the stages indicated. Moesrra-injected embryos display a significant number of apoptotic cells in the head (arrows) and body trunk (insets) at the all observed stages as compared to controls. A combination of MOesrra and MOp53 does not suppress cell apoptosis. (G,H) sox10:GFP embryos were injected similarly to A–F, raised to the indicated stages, and processed to determine proliferation of cartilaginous cells by phosphorylated histone H3 immunostaining (pH3, red signal) in pharyngeal regions. White arrows indicate proliferating chondrogenic cells marked by both green and red. Scale bar is 10µm. (I) The total number of proliferating cells in the pharyngeal arches is similar between control and MOesrra-injected embryos (6.5+/1.3 vs. 6.8+/1.0 cells in average, respectively; n = 27). Also, the number of proliferating cartilaginous cells (doubly positive for both green and red) is also similar between control and MOesrra-injected embryos (1.5+/1.0 vs. 1.0+/1.2 cell in average, respectively; n = 27).