
|
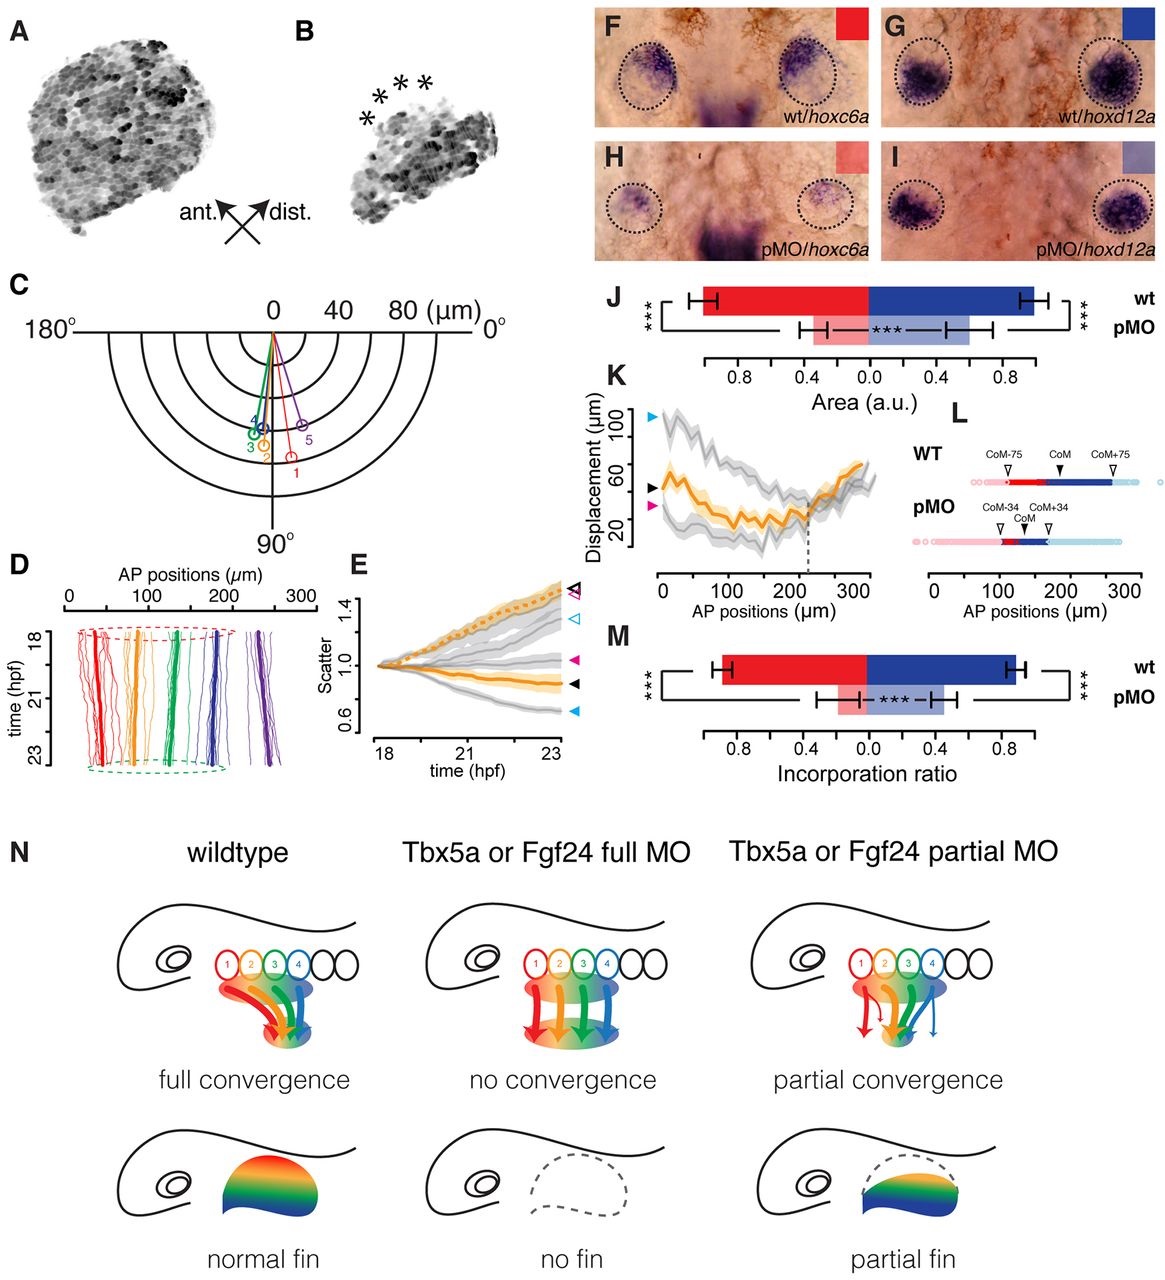
Fig. 6
Incomplete cell convergence in the fin-field of Tbx5a partial morphants is correlated with anteriorly biased truncations in fin buds. (A,B) Maximal intensity projections of the pectoral cartilaginous disc in 4dpf Tg(b-act2:Brainbow1.0L)pd49 larvae of an otherwise wild-type embryo (A) and a Tbx5a partial morphant (B); asterisks highlight lesions on the anterior edge of the cartilaginous disc. (C) Polar plot showing net average orientation and magnitude of displacement of the five track groups in eight Tbx5a partial morphant embryos. (D) Average net AP trajectories of five track groups relative to the overall trajectories in all LPM tracks in eight Tbx5a partial morphant embryos. Dashed circles highlight the similar AP extent of fin-field domains between 18 (red) and 23hpf (green). (E) Scatter values in eight wild-type embryos (blue arrowhead), eight Tbx5a full morphants (pink arrowhead) and eight Tbx5a partial morphants (black arrowhead). Solid arrowhead represents fin-field; open arrowhead represents peritoneum field. Lines represent eight-embryo average; shaded areas represent 95% confidence interval. (F-I) Expression patterns of hoxc6a (F,H) and hoxd12a (G,I) in the 36hpf fin buds of wild-type (wt; F,G) and Tbx5a partial morphant (pMO) embryos (H,I; dorsal view, anterior up). (J) Quantification of expression areas of hoxc6a (red) and hoxd12a (blue) in wild-type embryos (dark color) and Tbx5a partial morphants (light color; n=40 each). (K) AP displacement plotted against starting AP positions in eight wild-type embryos (blue arrowhead), eight Tbx5a full morphants (red arrowhead) and eight Tbx5a partial morphants (black arrowhead). Dashed vertical line represents the rough boundary at somite 4-5 between the fin and peritoneum fields. Solid lines represent eight-embryo average; shaded areas represent eight-embryo 95% confidence interval. (L) Track ending AP positions of fin-field tracks in eight wild-type embryos (WT) and eight Tbx5a partial morphants (pMO). CoM, center of mass; CoM-75/CoM+75, anterior/posterior limits of the wild-type fin bud; CoM-34/CoM+34, anterior/posterior limits of the Tbx5a partial morphant fin bud. (M) Quantification of incorporation ratio of anterior (red, somites 1-2) and posterior (blue, somites 3-4) fin-field tracks in wild-type embryos (dark color) and Tbx5a partial morphants (light color; n=40 each). Wilcoxon test: ***P=9.1×10⁴ (A tracks wild type-Tbx5a pMO); ***P=1.6×10⁴ (P tracks wild type-Tbx5a pMO); ***P=2.7×10³ (A tracks Tbx5a pMO-P tracks Tbx5a pMO). (N) Models of fin bud initiation in various conditions. First column: in wild types, fin-field cells undergo asymmetric and topological AP convergence. Fin-field positional information (rainbow color) translates into AP axis patterning in the fin. Second column: in Tbx5a or Fgf24 full morphants, all fin-field cells fail to converge, resulting in initiation failure and absence of fins. Third column: in Tbx5a or Fgf24 partial morphants, some fin-field cells fail to converge, with anterior fin-field cells preferentially mis-migrating. Given that positional information might be specified in the early fin-field, reduced incorporation of anterior progenitors results in the anteriorly biased truncation of the fin.