
Fig. 5
- ID
- ZDB-IMAGE-160208-18
- Publication
- Sisson et al., 2015 - A role of glypican4 and wnt5b in chondrocyte stacking underlying craniofacial cartilage morphogenesis
- All Figures
- Figures for Sisson et al., 2015
|
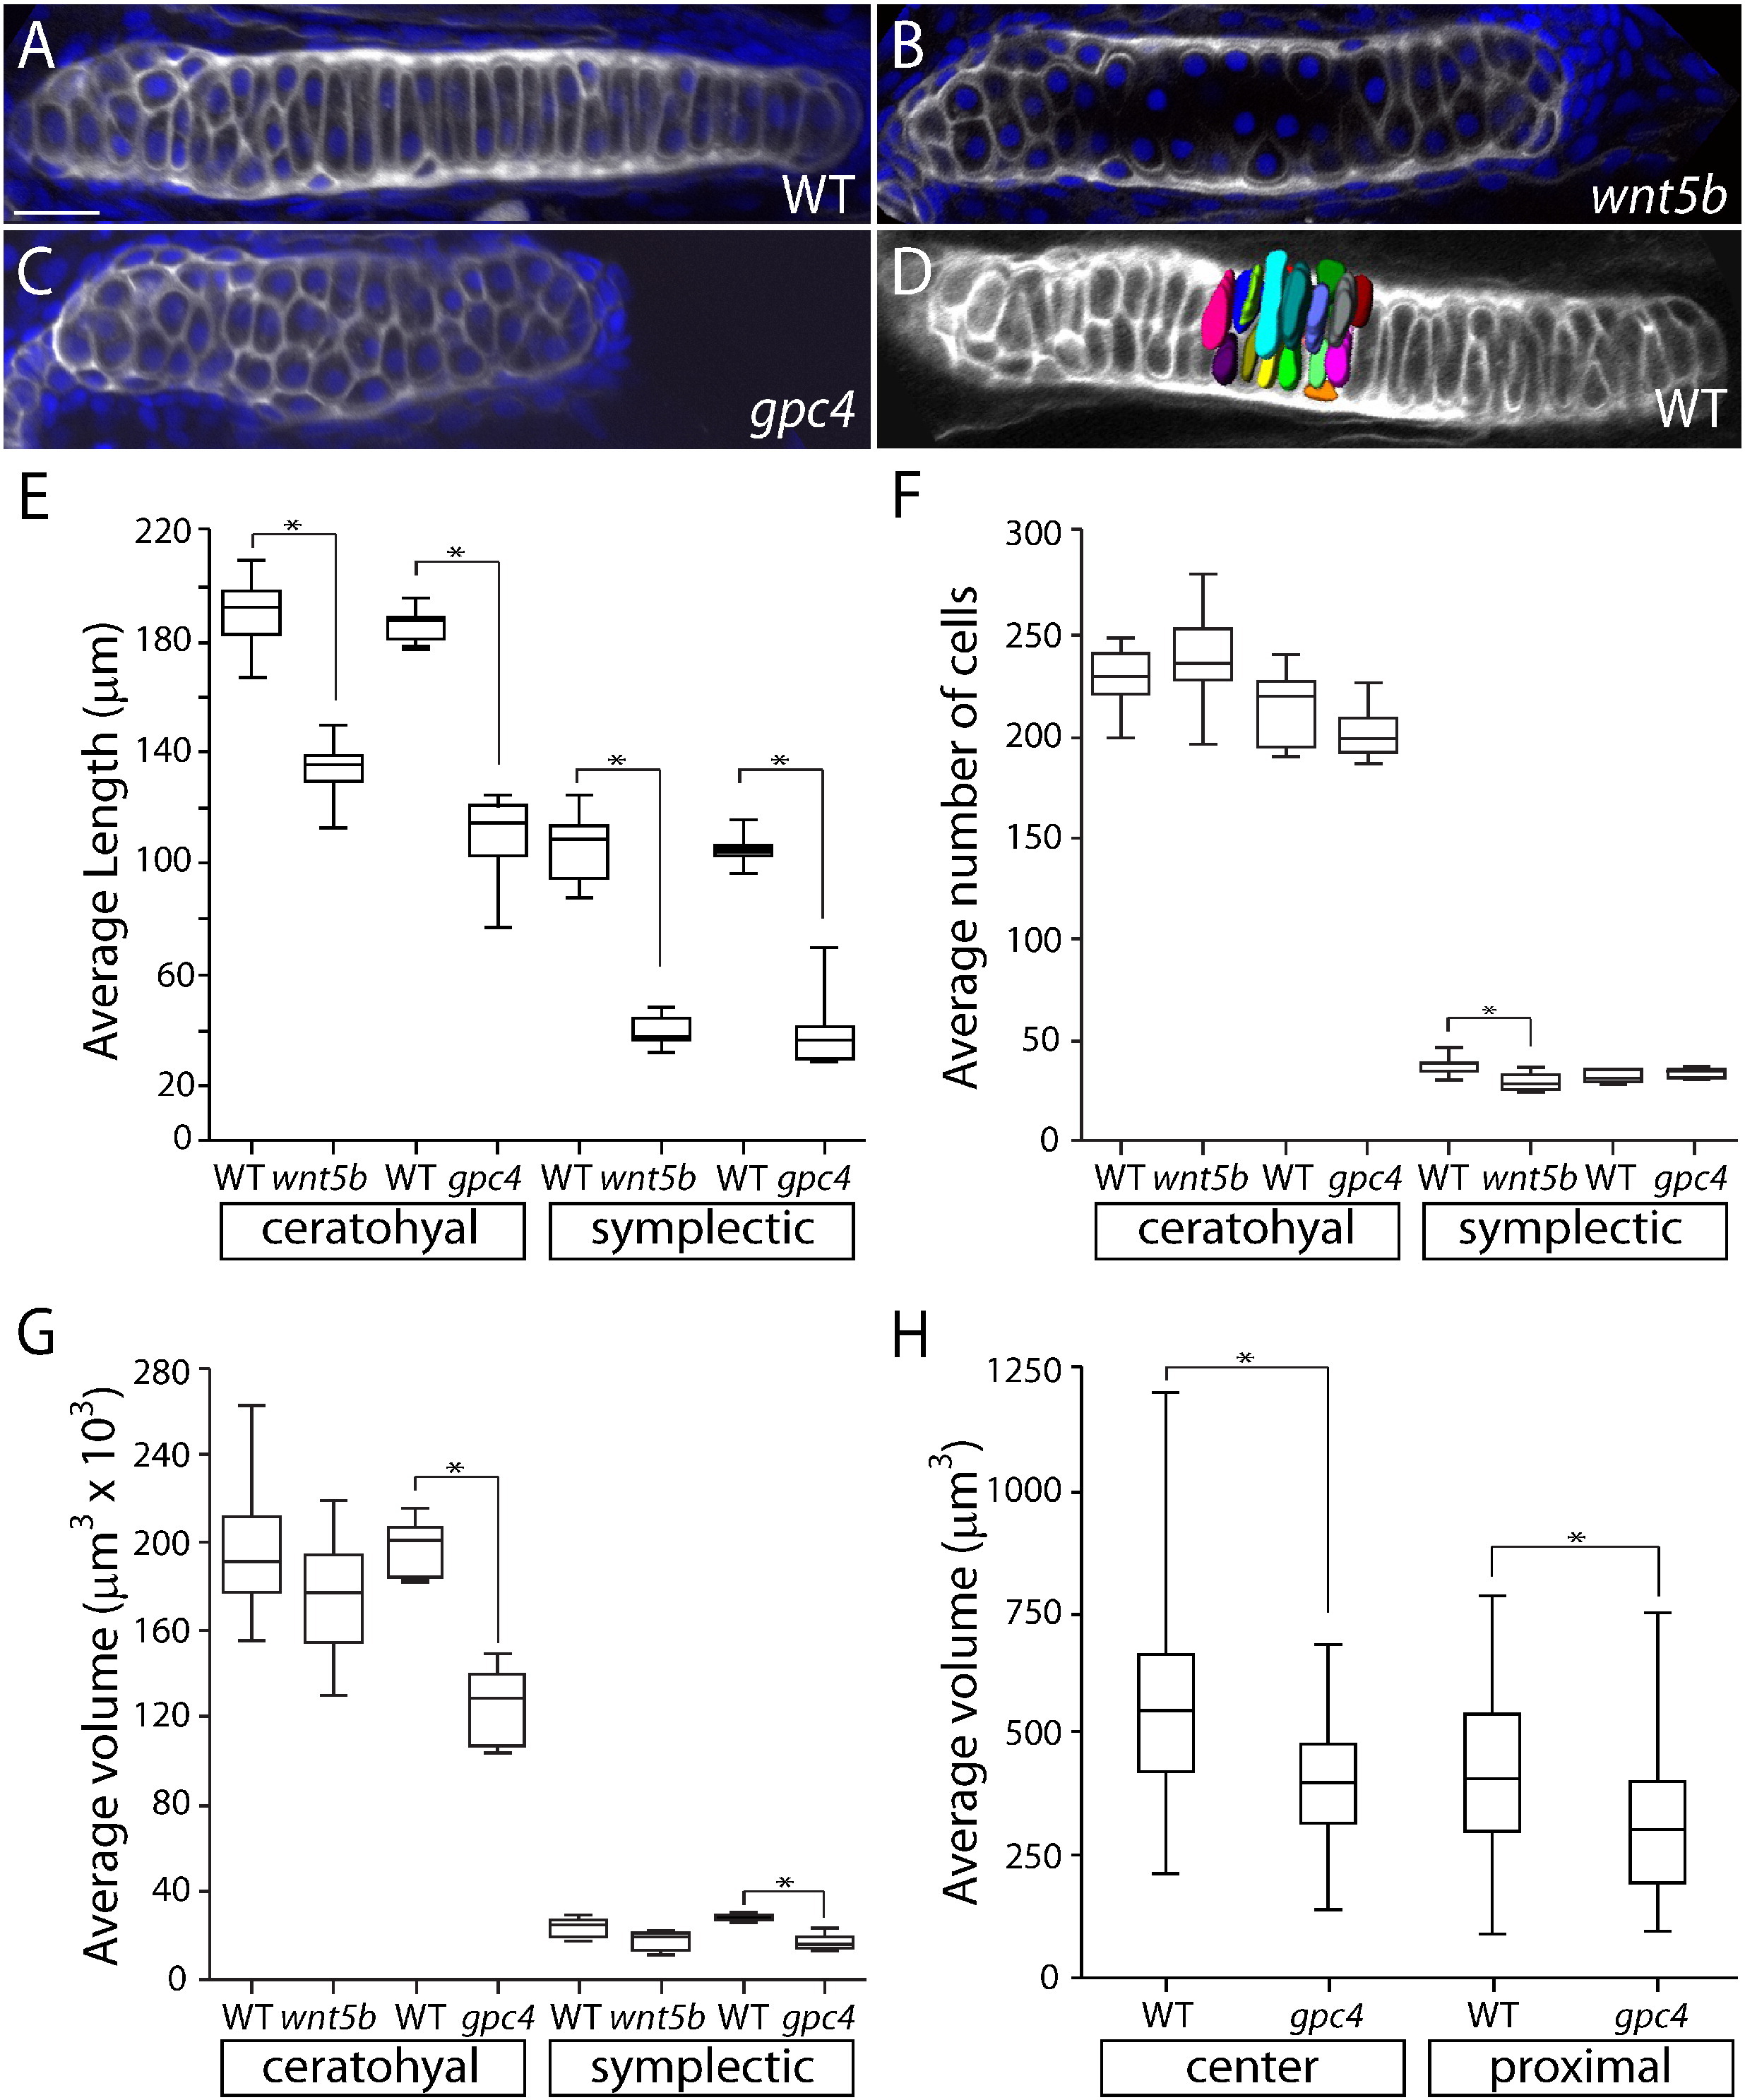
Fig. 5
Craniofacal cartilage volume is reduced in gpc4 mutants while the numbers of cells is unchanged. (A–C) Wheat germ agglutinin (gray) and DAPI (blue) staining of ceratohyal elements. (D) A 3D reconstruction of 20 cells in the center of a wild type ceratohyal stained with WGA to determine cell volume. (E) There is a significant difference between the average length of the ceratohyal and symplectic elements between the wild type and mutants. All are p = < 0.001. (F) The average number of cells in ceratohyal and symplectic elements. (G) The average volume of the ceratohyal and symplectic elements. The ratio of the ceratohyal element volume is Vfr6/VWT = 0.63. (E–G) Tests of four a priori hypotheses were conducted using a Bonferroni adjusted alpha level of 0.0125 (0.05/4). *p < 0.0125. (H) The average volume of 20 cells in the center and proximal ends from three ceratohyal elements from gpc4fr6 embryos and their phenotypically wild type siblings. Tests of two a priori hypotheses were conducted using a Bonferroni adjusted alpha level of 0.025 (0.05/2). *p < 0.025. The ratio of the center chondrocyte volume is Vfr6/VWT = 0.71. The ratio of the proximal chondrocyte volume is Vfr6/VWT = 0.74. Scale bar = 20 µm.
Reprinted from Mechanisms of Development, 138 Pt 3, Sisson, B.E., Dale, R.M., Mui, S.R., Topczewska, J.M., Topczewski, J., A role of glypican4 and wnt5b in chondrocyte stacking underlying craniofacial cartilage morphogenesis, 279-90, Copyright (2015) with permission from Elsevier. Full text @ Mech. Dev.