
|
Fig. 4 S1
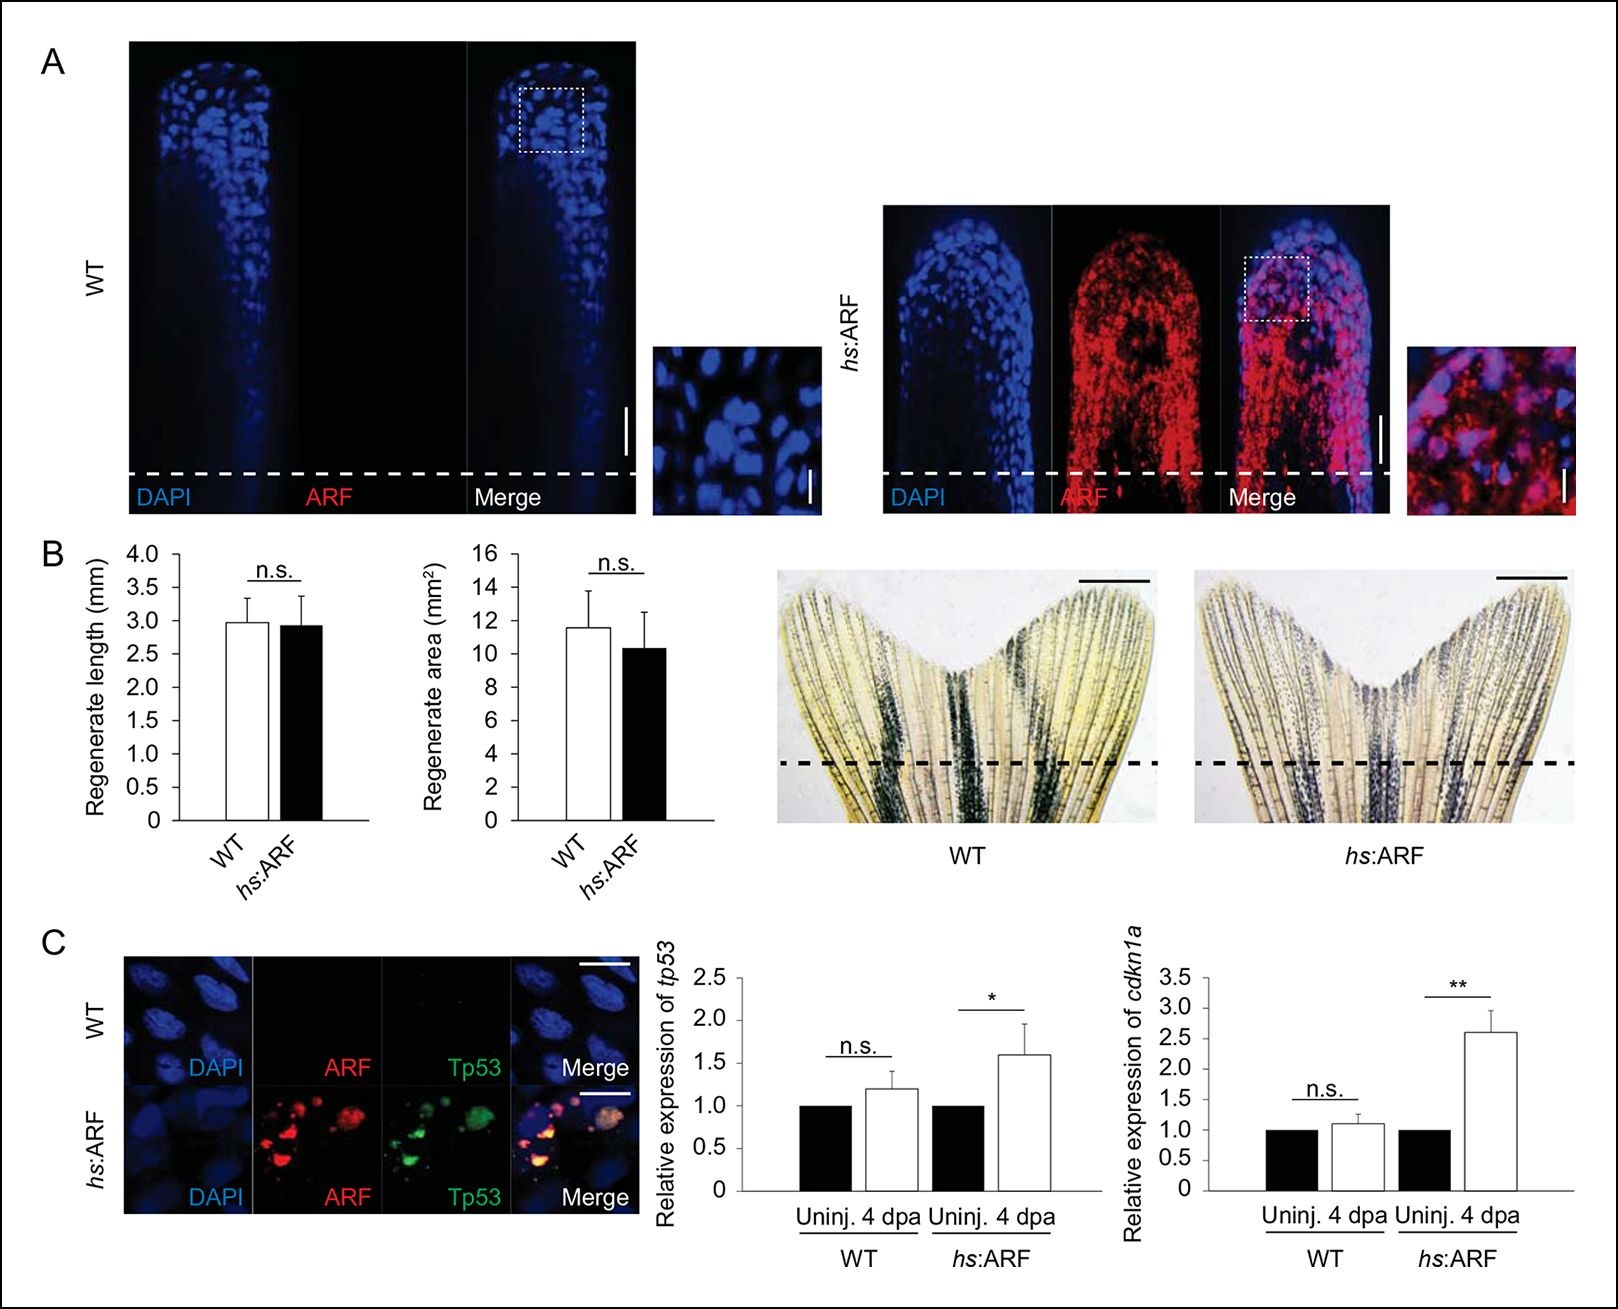
Rb1 hyperphosphorylation and E2f1 binding of the human ARF promoter in the blastema during regeneration.(A) Representative (sagittal confocal) images of WT and hs:ARF fins at 4 dpa. Scale bars: 50 µm. Dashed lines represent amputation planes. ARF localizes to the nucleus (inset). Scale bars: 10 µm. (B) Quantification of fin regenerate length and area in WT and hs:ARF at 14 dpa after heat shock was discontinued at 6 dpa (left; N = 10 fins, p>0.05). Representative images of WT and hs:ARF fins at 14 dpa after heat shock was discontinued at 6 dpa (right). (C) Representative images of ARF and Tp53 in WT and hs:ARF fins at 4 dpa (left). Scale bar: 10 µm. Tp53 expression is only detected in cells with ARF expression. Quantifications of relative tp53 (middle) and cdkn1a (right) transcript expression in uninjured (uninj.) WT and hs:ARF fin and regenerates at 4 dpa (N = 3 replicates). Expression was normalized to β-Actin transcripts and relative to uninjured fins within each condition. Significant increases in tp53 (N=5 fins, p<0.05) and cdkn1a (N =5 fins, p<0.01) were observed with ARF expression. Results are shown as mean ± standard deviation.hs: Heat shock; WT: Wild type. n.s.: not significant.