
|
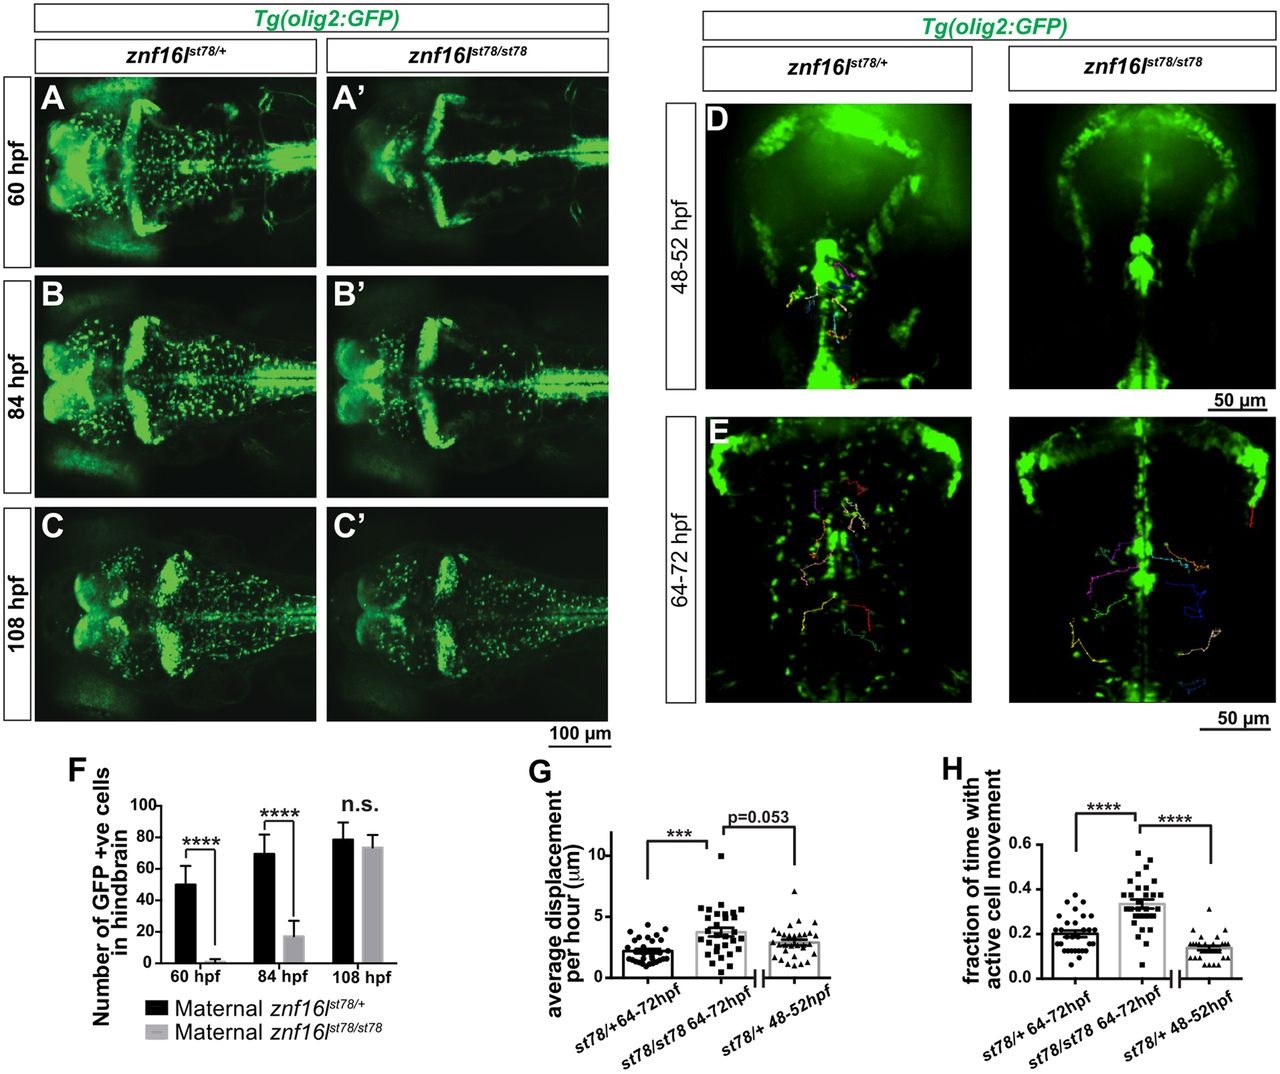
Fig. 3
Disruption of OPC migration in znf16l mutants. (A-C) znf16lst78 mutants and wild-type siblings in Tg(olig2:GFP) background. The number of OPCs is greatly reduced in the mutants at 60hpf (A,A2) and 84hpf (B,B2), but recovers quickly by 108hpf (C,C2). (D,E) Dorsal view of time-lapse imaging from 48-52 and 64-72hpf, with trajectories of 10 individual OPCs as they migrated laterally out of the midline, shown using the MTrackJ cell-tracking tool (n=3 fish per genotype, per time point). Cells were tracked every 15min in real time (see Movies 1-4 for time-lapse images). Genotypes of all embryos were determined by PCR after imaging. (F) Quantification of the number of GFP-expressing cells in the hindbrain of Tg(olig2:GFP) znf16lst78 mutants and wild-type siblings (n=15 wild type, n=9 mutant). The numbers were significantly different at 60 and 84hpf, but not at 108hpf (two-tailed Student′s t-test, ****P<0.0001). (G) Quantification of average OPC displacement (µm) per hour of 30 tracked cells from each timepoint. Mutant OPCs traveled farther than wild-type siblings. (H) Quantification of the fraction of time for which each OPC was actively moving. Mutant OPCs spent more time moving compared with wild-type siblings at either stage. Error bars show s.e.m. significance with one-way ANOVA and post hoc comparisons. ***P=0.0003 in G; ****P<0.0001 in H.