
IMAGE
Fig. 4
Image
|
Figure Caption
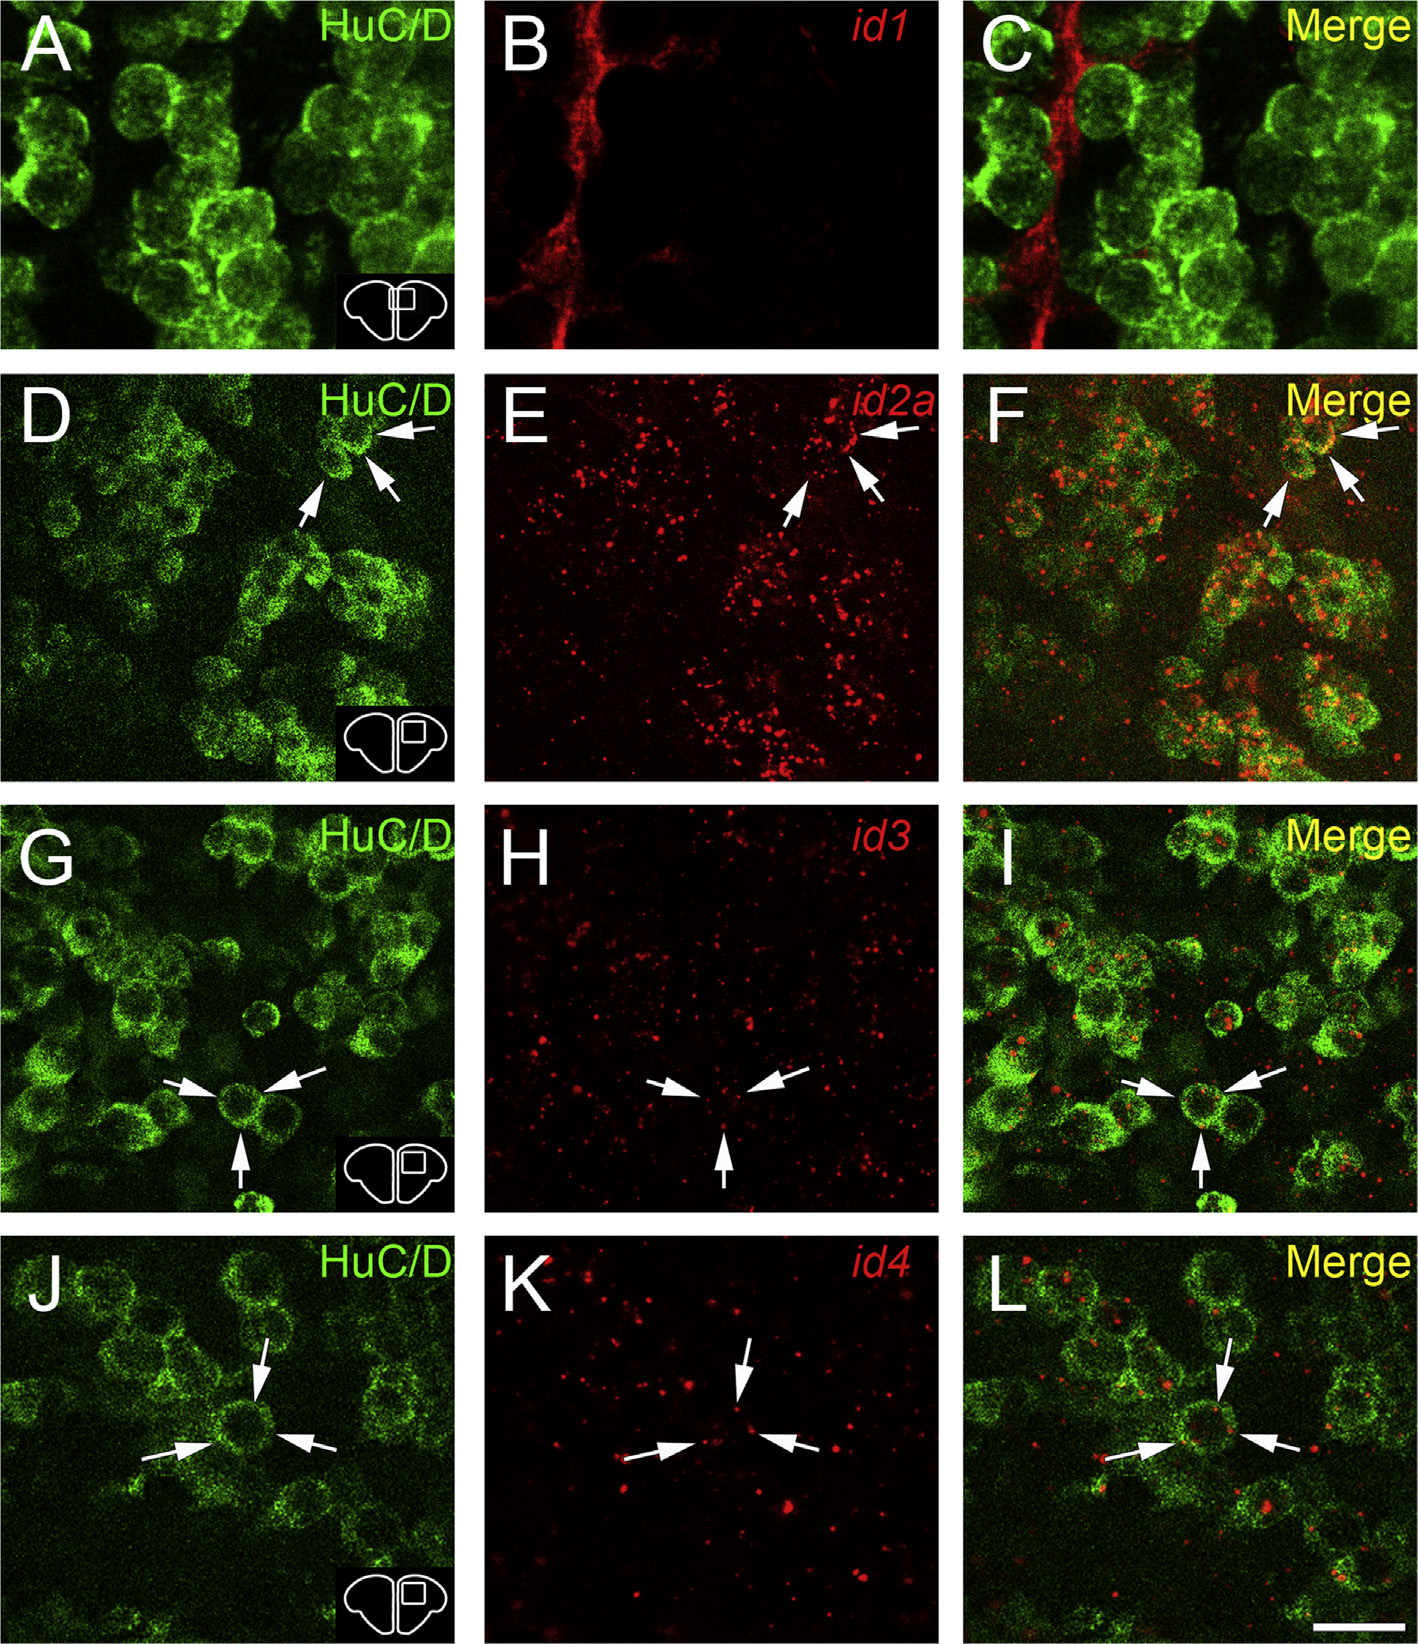
Fig. 4 id2a, Id3 and Id4 expression in HuC/D-positive neurons. A to L: Anti-GFP immunohistochemical staining on Tg(id1:EGFP) fish (GFP artificially put in red) and id2a, id3 and id4 in situ hybridization on WT fish (red) followed by HuC/D immunohistochemistry (green). The arrows show id2a, id3 and id4 mRNAs detection in HuC/D-positive neurons. The id1 transgene is not detected in neurons. Scale bar: 7 µm (A to C); 16 µm (D to I); 11 µm (J to L).
Figure Data
Acknowledgments
This image is the copyrighted work of the attributed author or publisher, and
ZFIN has permission only to display this image to its users.
Additional permissions should be obtained from the applicable author or publisher of the image.
Reprinted from Gene expression patterns : GEP, 19(1-2), Diotel, N., Beil, T., Strähle, U., Rastegar, S., Differential expression of id genes and their potential regulator znf238 in zebrafish adult neural progenitor cells and neurons suggests distinct functions in adult neurogenesis, 1-13, Copyright (2015) with permission from Elsevier. Full text @ Gene Expr. Patterns