
Image
|
Figure Caption
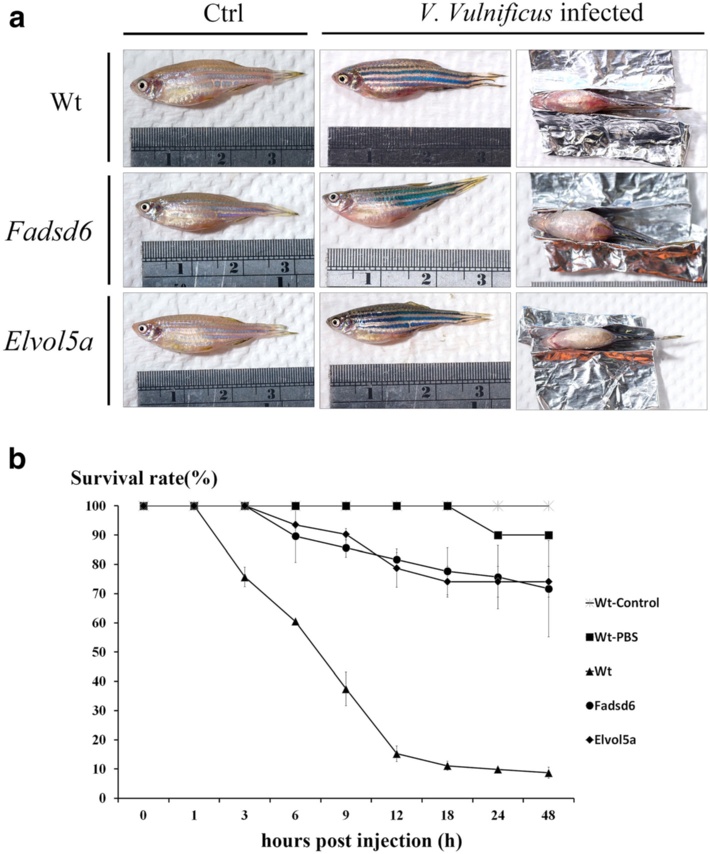
Fig. 3
Survival rates of zebrafish after infection with V. vulnificus for 48 h (a) Photographs of Wt zebrafish control (left) and Wt fish challenged with V. vulnificus (middle and right) at 9 h after IP injection revealed bleeding at the ventral sides of the infected fish body. (b) Survival rates of Wt and transgenic fish injected with V. vulnificus (Wt-control was not infected and Wt-PBS was injected with PBS). Survival rates were determined at the indicated times after infection. Each experimental group contained 30 adult zebrafish
Acknowledgments
This image is the copyrighted work of the attributed author or publisher, and
ZFIN has permission only to display this image to its users.
Additional permissions should be obtained from the applicable author or publisher of the image.
Full text @ J. Biomed. Sci.