
Image
|
Figure Caption
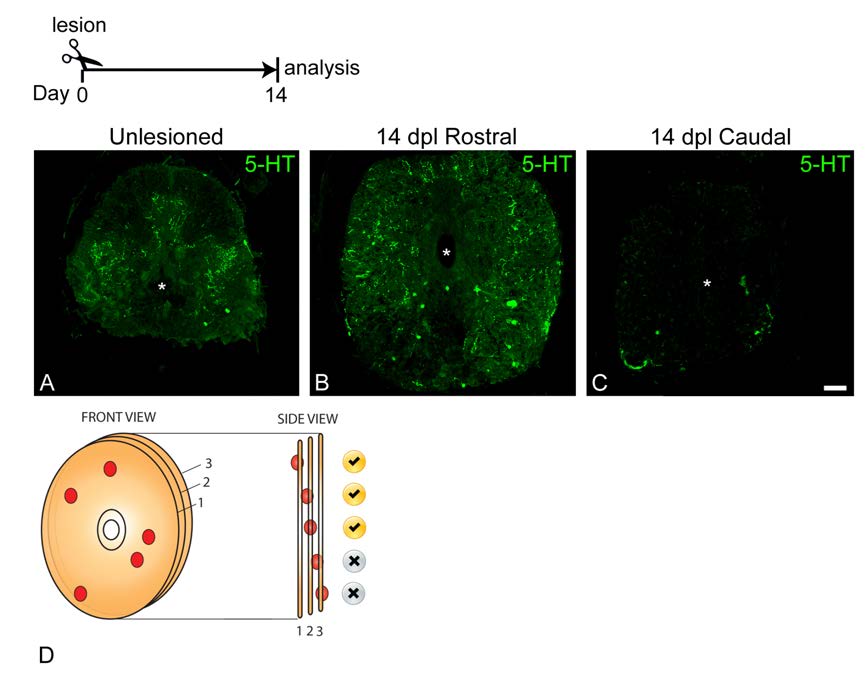
Fig. S2 Characterization of serotonergic (5-HT) signal and pMN progenitors.
A-C: Distribution of serotonergic axons in the unlesioned and lesioned spinal cord at 14 days post-lesion is shown in cross sections through the spinal cord; asterisks indicate the central canal.
D: Schematic representation of cell counts in spinal cord sections. All cells are included in the counts, except for those cells that are visible in the last optical section.
Scale bar in C = 50 µm.
Acknowledgments
This image is the copyrighted work of the attributed author or publisher, and
ZFIN has permission only to display this image to its users.
Additional permissions should be obtained from the applicable author or publisher of the image.
Full text @ Cell Rep.