
Image
|
Figure Caption
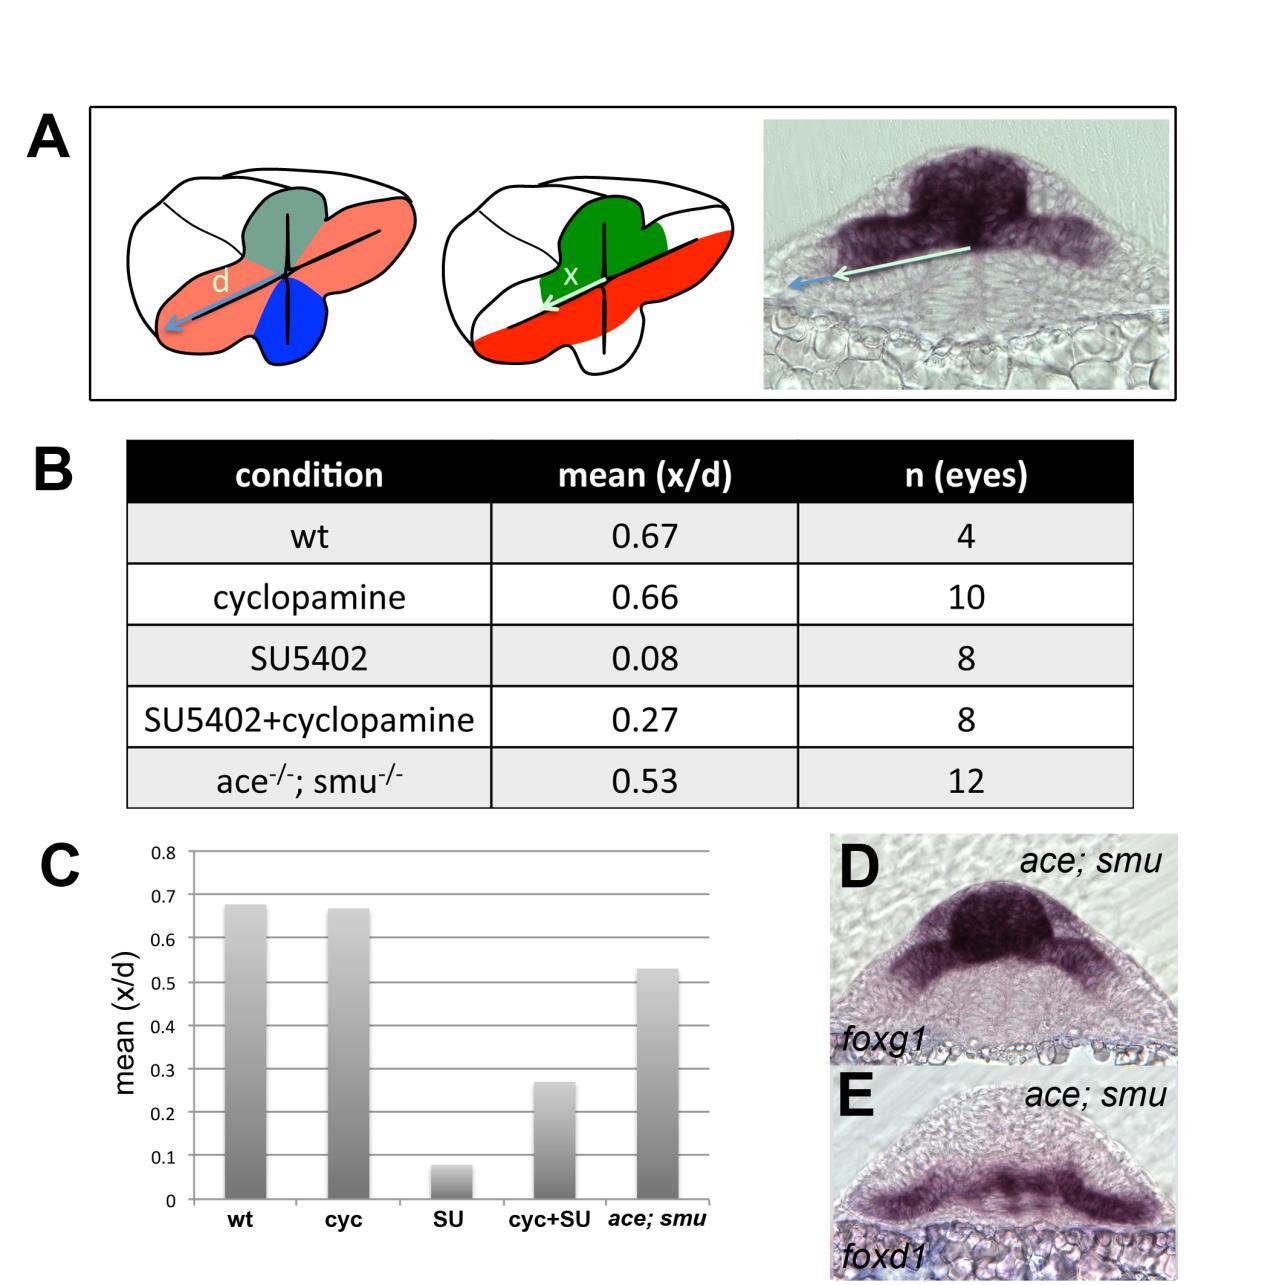
Fig. S4 Quantification of extension of foxg1 expression in all the experimental conditions presented in the study. (A) Rationale of the quantification strategy. Dividing x by d normalises the extension of foxg1 expression to the total length of the optic vesicle. (B) Table showing the mean of x/d for the number of eyes (n) quantified. (C) Graph representing the results from (B).
Acknowledgments
This image is the copyrighted work of the attributed author or publisher, and
ZFIN has permission only to display this image to its users.
Additional permissions should be obtained from the applicable author or publisher of the image.
Full text @ Development