
|
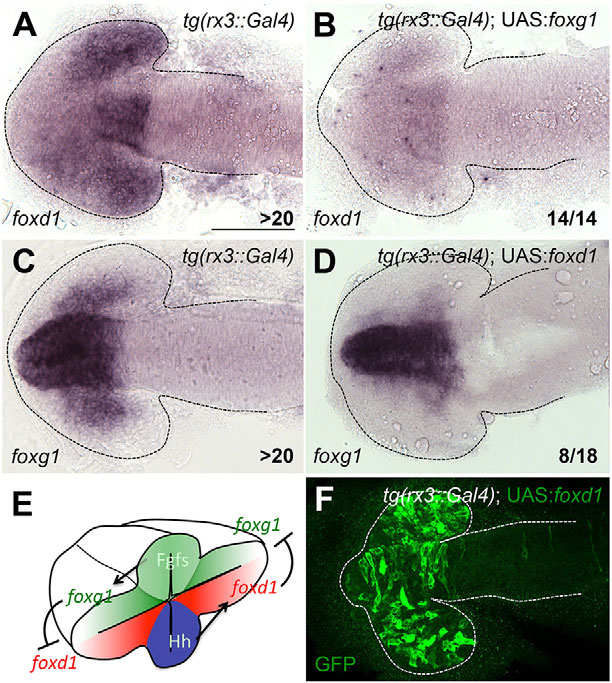
Fig. 5
Mutual repression between foxg1 and foxd1 maintains the NT border. (A-D) foxd1 (A,B) and foxg1 (C,D) expression in the conditions detailed in the panels. All panels show dorsal views with anterior to the left at 10-12ss. (E) Schematic representation of the regulatory interactions inferred from our manipulations. (F) Representative Tg (rx3:Gal4); UAS:foxd1 embryo showing widespread GFP expression in the optic vesicles. All embryos selected for in situ analysis showed similarly broad GFP expression. Scale bar: 100µm. Numbers in the bottom-right of each panel indicate the number of embryos with the phenotype shown out of the total number of embryos analysed. Dashed lines outline the forebrain.