
|
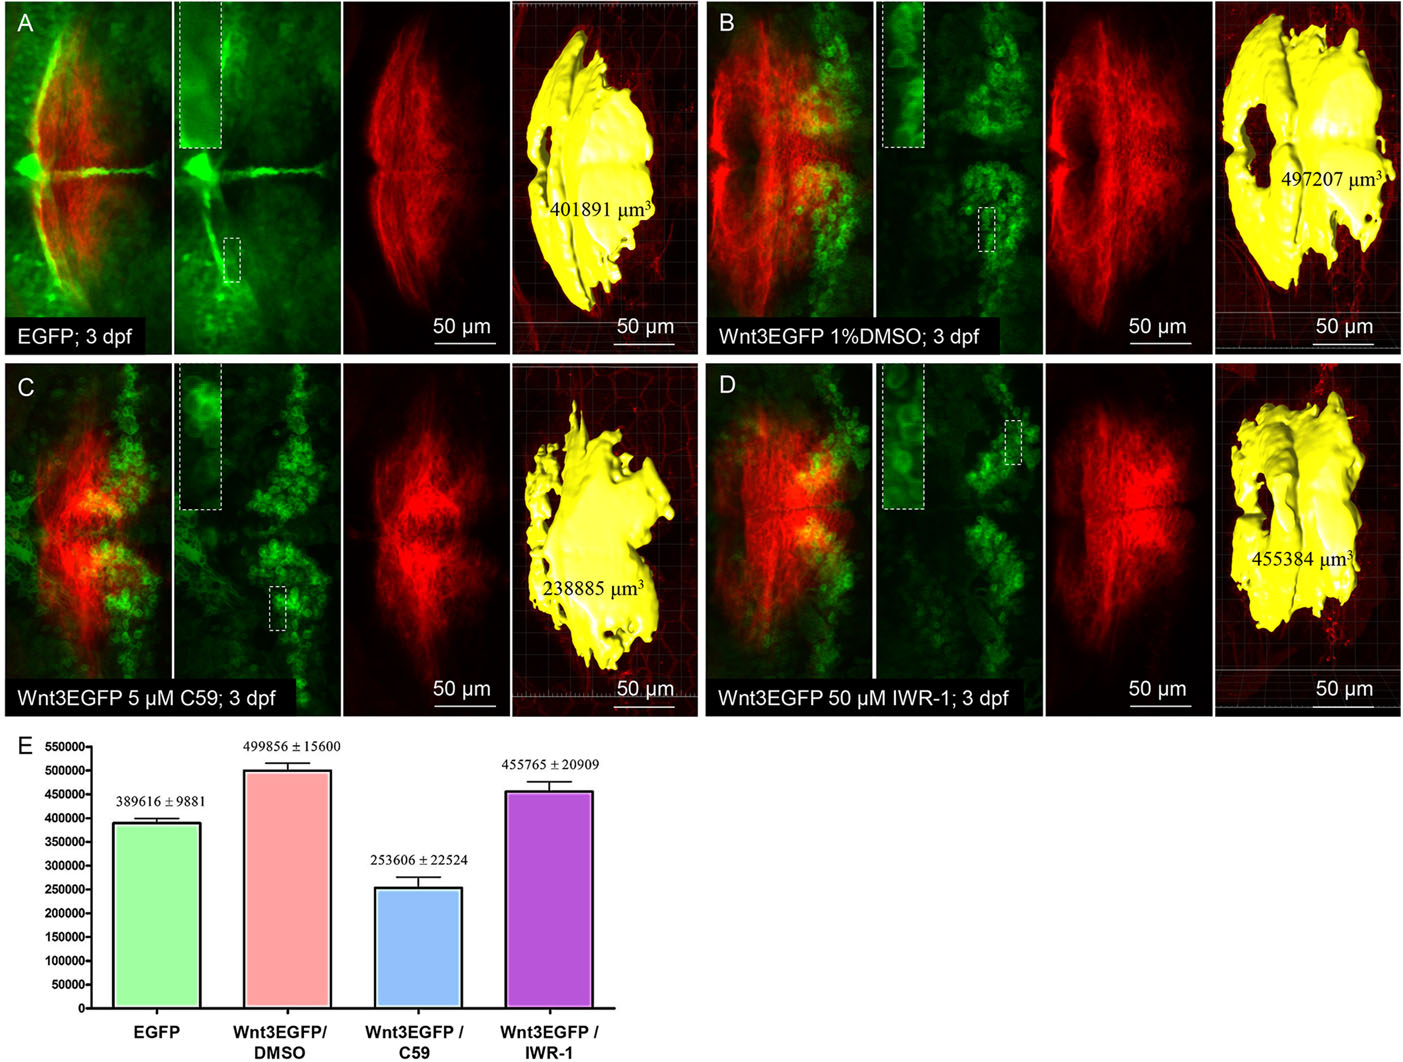
Fig. 8
Exposure of Tg(wnt3:Wnt3EGFP)F3 larvae to Wnt inhibitor C59 decreased the segmental volume of cerebellum in Tg(memKR15-16). (A-D) In vivo images of 3dpf double transgenic larvae: control Tg(wnt3:EGFP)F1/Tg(memKR15-16) (A), Tg(wnt3:Wnt3EGFP)F3/Tg(memKR15-16) (B-D). All Tg(wnt3:wnt3EGFP)F3 double transgenic larvae were exposed to either 1% DMSO (B), 5µM C59 (C) or 50µM IWR-1 (D) at 36hpf-stage for 36h before assaying expression of fluorescent reporter at 72hpf. High-magnification view of representative EGFP/Wnt3EGFP-expressing cells from different treatment groups (insets). KillerRed expression in the MHB and cerebellum of Tg(memKR15-16) is in red; EGFP or Wnt3EGFP expression in wnt3 transgenics is in green; and yellow represents a 3D view of the computed volume. (E) Comparison of the resultant KillerRed-positive brain segment in Tg(memKR15-16). A significant difference was observed between segmental volumes in 1% DMSO-treated Tg(wnt3:Wnt3EGFP)F3 vs C59-treated Tg(wnt3:Wnt3EGFP)F3 (unpaired t-test, P=0.0001).