
|
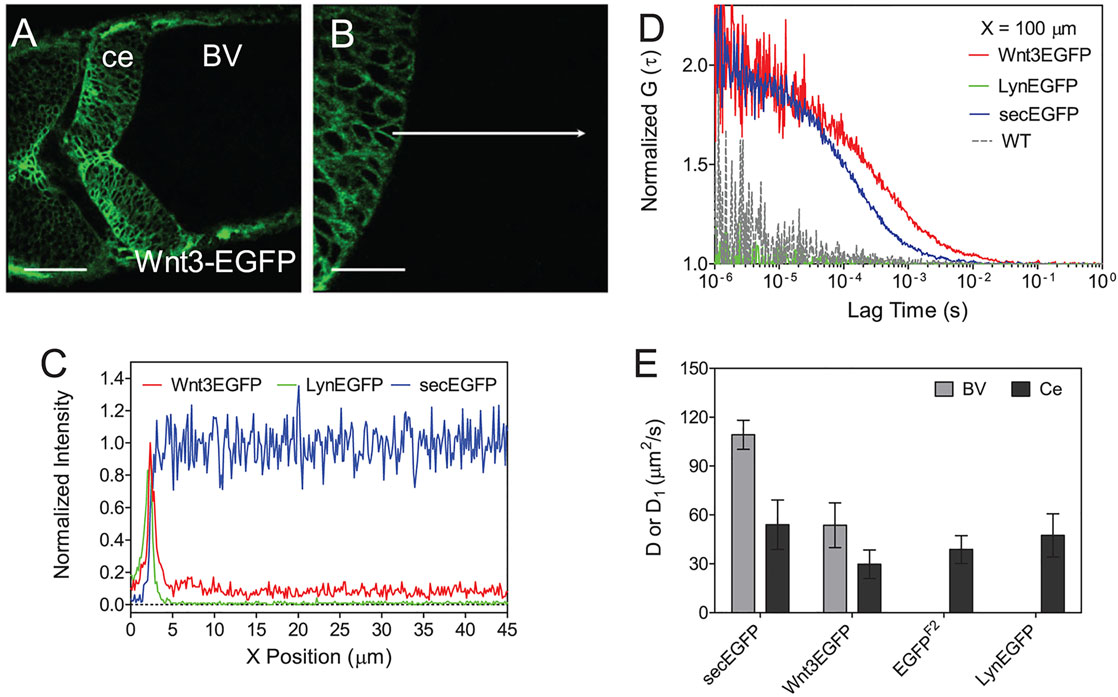
Fig. 6
Wnt3EGFP, LynEGFP and secEGFP in the fourth brain ventricle. (A) Confocal image of zebrafish cerebellum expressing Wnt3EGFP at 34hpf. Scale bar: 50µm. (B) Zoom of A at 3× magnification with focus on the cerebellum boundary and flanking brain ventricle. Scale bar: 20µm. Images were taken in dorsal view. BV, brain ventricle; ce, cerebellum. The images were modified using Imaris to increase the contrast. (C) Normalized fluorescence intensity from the cerebellum boundary cell to the brain ventricle along the white arrow in B of Wnt3EGFP (red), LynEGFP (green) and secEGFP (blue). Data are the average of three scans of three embryos for each type to the highest point. (D) Normalized ACF curves taken within a ventricle at 100µm from the cerebellum boundary. Color-coding is the same as in C together with wild type (WT, dotted gray). The results show the free diffusion of Wnt3EGFP and secEGFP in the brain ventricle, whereas no fluorescence can be detected either for LynEGFP or for WT. (E) Diffusion coefficients extracted from fit for different types of EGFP-labeled proteins in both the cerebellum and the brain ventricle. secEGFP serves as an intercellular indicator of protein mobility in multicellular tissue and extracellular indicator in the brain ventricle. EGFP reporter Tg(-4.0wnt3:EGFP)F2 and LynEGFP transgenics Tg(-8.0cldnB:lynEGFP) serve as an indicator of intracellular protein mobility. Data are mean±s.d. Light gray bar, brain ventricle (BV); dark gray bar, cerebellum (ce). See also Fig. S2 and Tables S2, S3.