
|
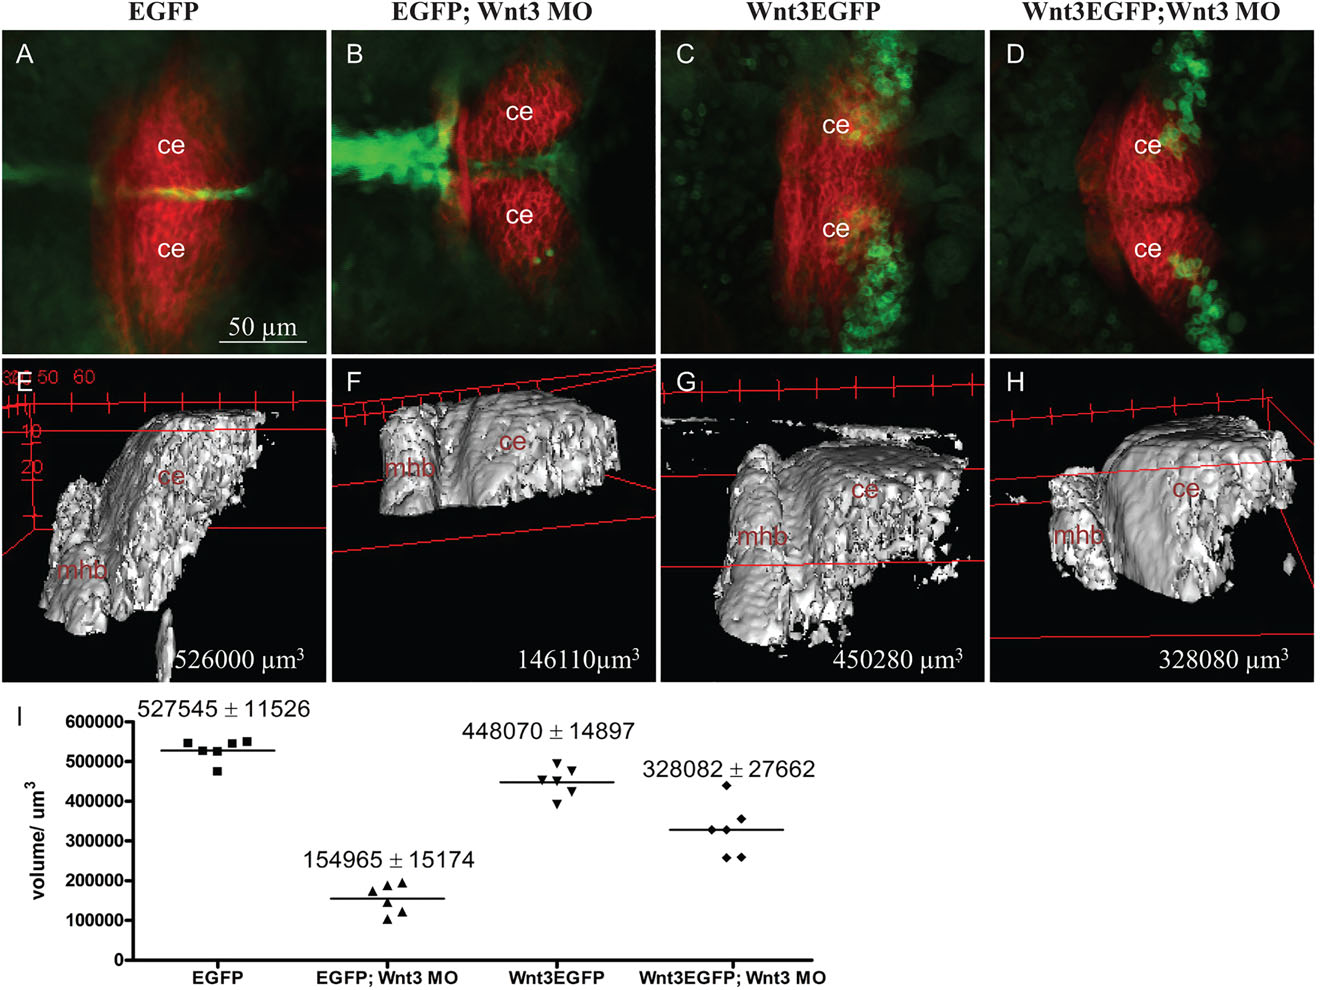
Fig. 4
Expression of Wnt3EGFP in the cerebellum of Tg(wnt3:Wnt3EGFP)F3 partially compensates cerebellum growth in MO1-injected Wnt3 morphants. (A-D) Dorsal view of double transgenic Tg(memKR15-16) larvae co-expressing KillerRed with EGFP from Tg(wnt3:EGFP)F1 (A,B) or Wnt3EGFP from Tg(wnt3:Wnt3EGFP)F3 (C,D). KillerRed is expressed in the MHB and cerebellum. Reduction in KillerRed-positive cerebellum is partially compensated in 3dpf Tg(wnt3:Wnt3EGFP)F3 MO1-morphants (D). (E-H) 3D lateral view of KillerRed-positive MHB and cerebellum in Tg(wnt3:EGFP)F1 (E), MO1-injected Tg(wnt3:EGFP)F1 (F), Tg(wnt3:Wnt3EGFP)F3 (G) and MO1-injected Tg(wnt3:Wnt3EGFP)F3 at 3dpf (H). (I) Scatter plot of computed volumes. The decrease in segmental volume in Tg(memKR15-16) is significant between MO1-morphants and un-injected siblings. Unpaired t-test comparing Tg(wnt3:EGFP)F1 vs MO1-morphant Tg(wnt3:EGFP)F1, P<0.0001; Tg(wnt3:wnt3EGFP)F3 vs MO1-morphants Tg(wnt3:Wnt3EGFP)F3, P=0.0034. Segmental volume in MO1-morphant Tg(wnt3:Wnt3EGFP)F3 remains significantly higher than in MO1-morphant Tg(wnt3:EGFP)F1 (P=0.0003). ce, cerebellum; mhb, midbrain hindbrain boundary.