
|
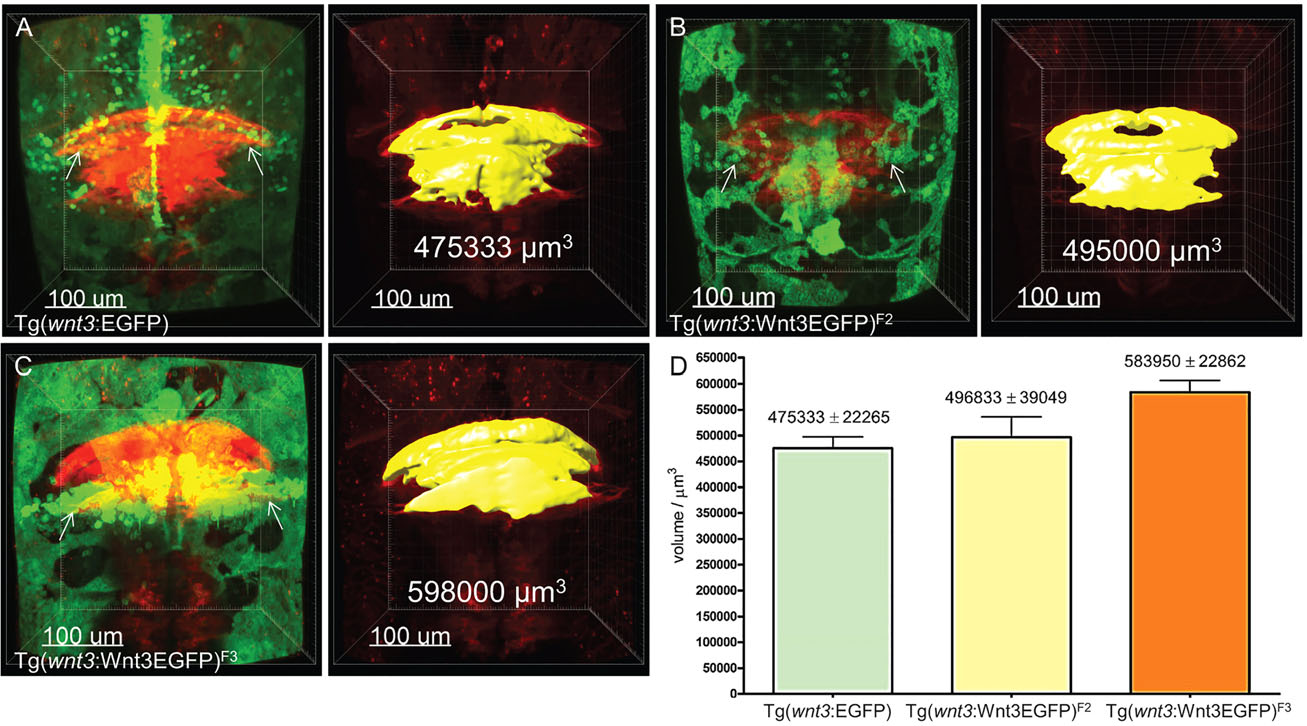
Fig. 3
The size of the MHB and cerebellum segmental volume correlates with the level of Wnt3EGFP expression. (A-C) In vivo comparison of segmental volume in Tg(memKR15-16) in EGFP or different Wnt3EGFP transgenics background at 4dpf. Tg(memKR15-16)/EGFP (A), Tg(memKR15-16)/Wnt3EGFP [Tg(wnt3:Wnt3EGFP)F2] (B) and Tg(memKR15-16)/Wnt3EGFP [Tg(wnt3:Wnt3EGFP)F3] (C). KillerRed expression in the MHB and cerebellum of Tg(memKR15-16) is in red; EGFP or Wnt3EGFP expression in wnt3 transgenics is in green; and yellow represents a 3D view of the computed volume. (D) The increase in segmental volume in Tg(memKR15-16) is significant according to unpaired t-test comparing Tg(wnt3:EGFP)F1 vs Tg(wnt3:wnt3EGFP)F3 (P=0.0022). Arrows show expression of EGFP/Wnt3EGFP in the cerebellum.