
|
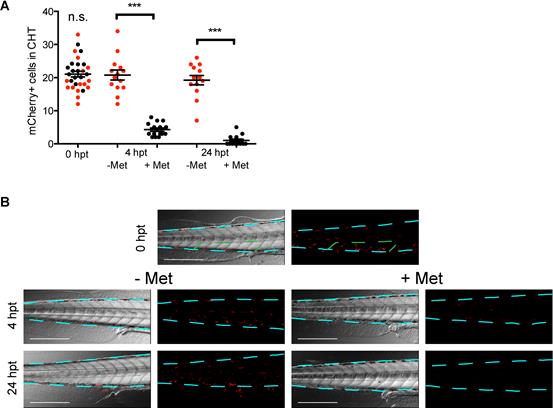
Fig. S1 Metronidazole treatment ablates mCherry positive cells in mpeg1-Gal4 x UAS:nfsBmCherry line. To assess the efficacy of macrophage depletion Tg (mpeg1:G/U:NfsB-mCherry) larvae were assessed for the number of mCherry positive cells in the caudal hematopoietic tissue (CHT), 6 somites posterior to the anal vent (green outline in B) before 0 hours post treatment (0 hpt) and after 4 and 24 hours with (+Met, black dots, n=15) or without (-Met, red dots, n=15) Metronidazole. (A&B) There was no significant difference between +Met and –Met treatment group at 0 hpt and significantly reduced numbers of mCherry positive cells after 4 and 24 hpt in +Met larvae compared to the –Met larvae (p<0.001). Images are overlays of a single slice in DIC channel and maximum projection (25 slices) in the red channel or red channel only. Scale bar represents 250 µm and blue dash line outline the body of the fish.