
|
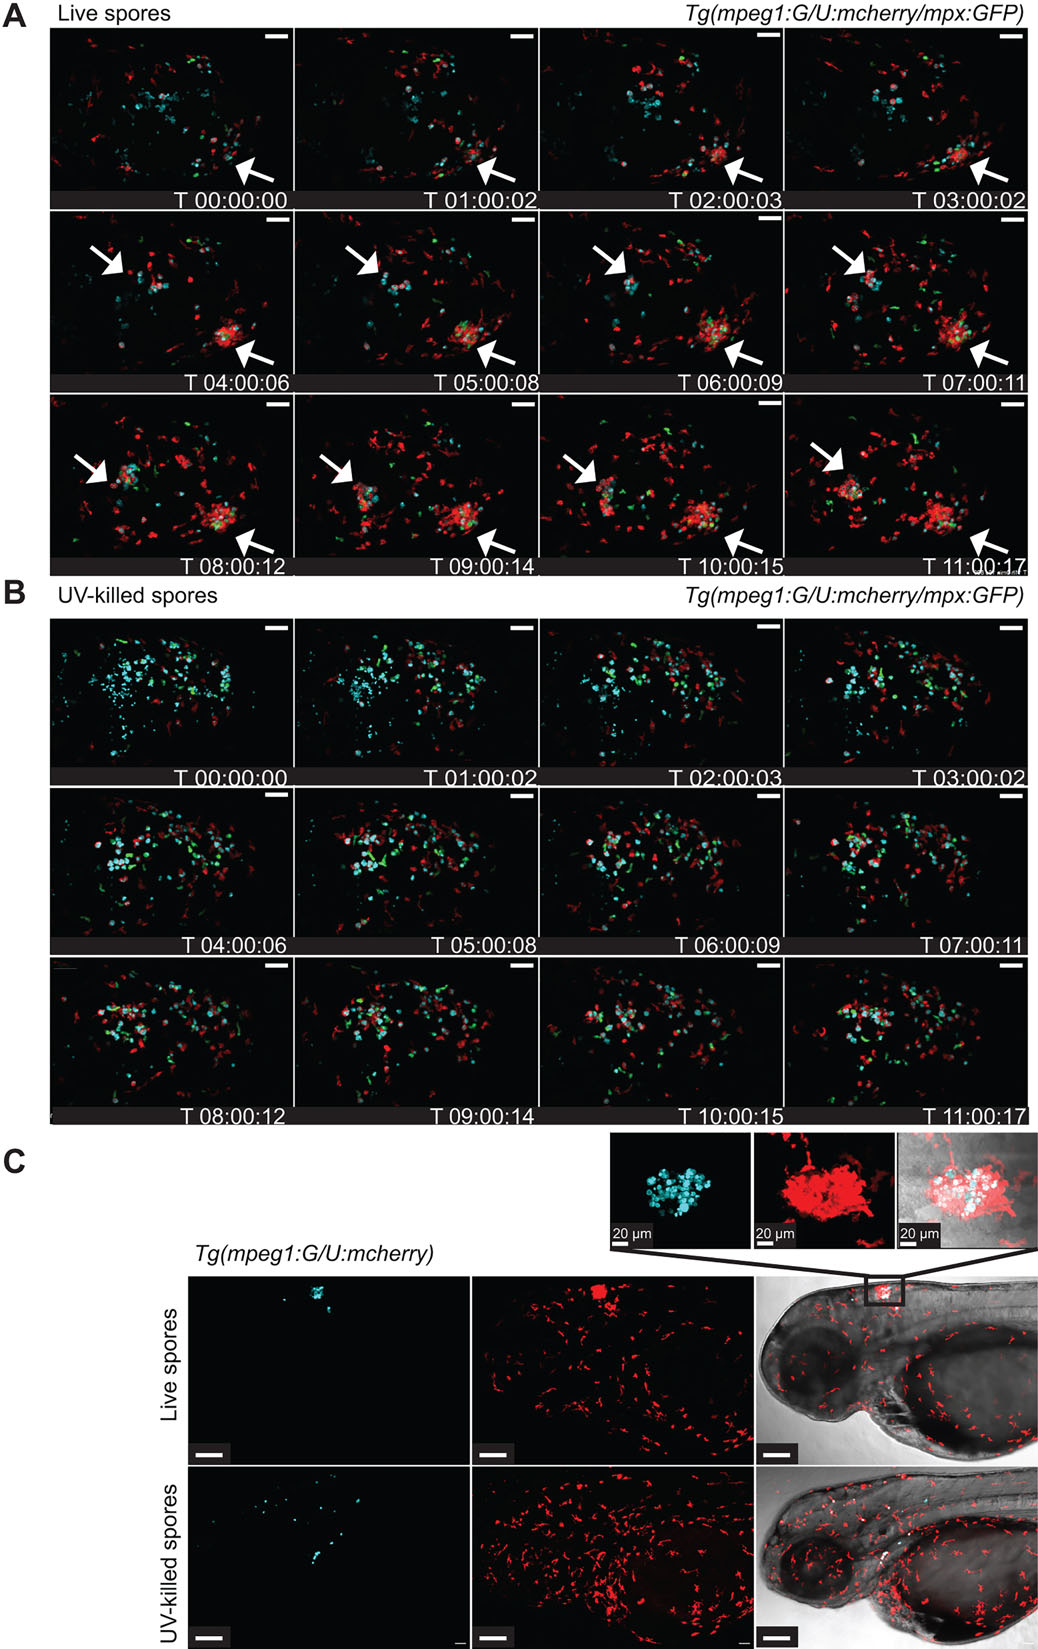
Fig. 3
Phagocytes accumulate at the site of live spore injection in the hindbrain infection model. (A) Macrophages and neutrophils accumulate around viable spores (z-stack: 15 sections every 7.3µm; scale bar: 40µm; see also Movie 2). (B) Significantly less macrophage and neutrophil clustering was observed in larvae injected with UV-killed spores (z-stack: 15 sections every 7.3µm; scale bar: 40µm; see also Movie 3). (C) Formation of clusters around viable spores was correlated with low levels of spore dissemination, whereas non-viable spores did disseminate efficiently throughout the fish (z-stacks: 30 sections every 10.35 and 9.25µm, respectively, scale bars: 50µm; zoomed in section: z-stack 31 sections every 1µm). Time is expressed as h:min:s starting at 1h after injection.